After it looked like crude oil may retest the previous lows that we saw back on May 15, instead we've seen the market rebound to the highest price in about a week, writes Matt McKinney of Zaner Group.
Fundamentally, in my view, a couple of the reasons this occurred is what I read in a Bloomberg article that made good sense. The article titled WTI Crude Rises on Speculation Growth Will Boost Demand that read, "Futures increased 0.9% as the Thomson Reuters/University of Michigan preliminary index of consumer sentiment rose to 83.7 in May, higher than any projection in a Bloomberg survey. A government report then showed Japanese gross domestic product grew 3.5% at an annualized pace, the most in a year." I could really sink my teeth into those solid fundamentals so whether this was the real reason we saw crude move higher Friday or maybe just a technical move is irrelevant. It was one of the "camps" that I was in as you will see if you read my previous articles. Now the real question is will we test $98 or $100/barrel.
CME Options on Futures: The Basics
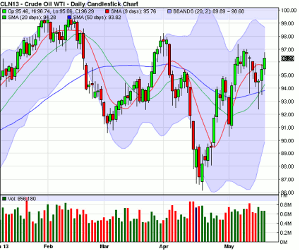
Technically, according to this daily CL (crude oil) chart, the market has closed above all of my indicators including the 9-, 20-, and 50-day simple moving averages. The 9-day SMA (red line) is starting to point sideways. The 20-day SMA (green line) is pointing higher and it just crossed over and above the 50-day SMA (blue line). The market closed Friday above all of them, which I guess is somewhat bullish, but I'm still a bear over the medium term.
JULY NYMEX CRUDE OIL DAILY CHART
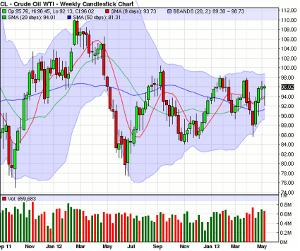
Technically, what I like about this weekly chart is the fact that the Bollinger Bands (light blue shaded area, BB) are tight from top to bottom presently. The bottom line of the BB is at $89.30/barrel and the top line of the BB is at $98.73/barrel. That to me shows a tight trading range according to my technical indicator, the Bollinger Bands. I've also noticed that the 9-, 20-, and 50-period SMAs are pointing sideways for the most part.
Options Play
A potential options play could be to sell deep out-of-the-money calls. This could be the riskiest play possible, and is not for everyone. At the same time, it can be a slow and steady way to build your account. This type of strategy does not only have unlimited risk, but it requires discipline, patience, and a generously funded account. Or you could buy puts for protection in a three to one ratio.
The play in buying options here could potentially be to buy outright put options or bear put spreads. When we do this, I always recommend that in a 3 to 1 ratio, we buy a call (in this case because I am bearish). The 3 to 1 ratio is something that I have worked on for about 15 years...I've tried 5 to 2, 5 to 1, 4 to 1, 4 to 2; while there are no guarantees at all, the 3 to 1 seems to work as a good insurance policy, if we are really wrong, not only do we sleep better at night, but the call in this case could really soften the blow as it may go up in value as our puts come down in value. So depending how much you like the trade, you could place a 3 to 1, 6 to 2, 9 to 3, 12 to 4, 15 to 5, or 60 to 20. It just depends on how much risk tolerance you have and how much you like the trade.
By Matt McKinney of Zaner Group


