If you are buying options it's important to buy them as cheaply as possible, writes Markus Heitkoetter of Rockwell Trading, because your break-even point will also be lower, thus allowing you to reach profitability sooner, too.
In the previous two blog posts, we talked about some simple strategies for buying and selling options. In this blog post we will discuss more advanced options trading strategies, vertical spreads, straddles, and strangles.
Don't worry! I'll keep it simple
Strategy 1: Vertical Spreads
When trading a vertical spread, you are buying and selling options of the same underlying stock (e.g. AAPL), same expiration date, but at different strike prices.
There are two main reasons for using vertical spreads:
- Limit your risk when selling options
- Reduce your cost when buying options
- Here are examples for both scenarios:
Reason 1: Limit Your Risk
In my blog post, Swing Trading Options - Part 2, I discussed the strategy to collect premium. I used the following example: AAPL is trading at $440, and we believe that AAPL will not trade below $425 until expiration (18 more days). Therefore, we decide to sell the $425 put option for $6.65 and collect $665 in premium. As discussed previously, we are fine if AAPL closes above $425 on expiration day, but we have unlimited risk if the price of AAPL falls. For a more detailed explanation, please take a look at the previous blog post).
We can limit our risk, if we buy a $420 put option. The price of the option is $4.90, so we have to pay $490 for the option. We still keep $175 ($665 - $490 = $175) if things work out as we expect, and now our risk is limited.
Here's why:
As you know, when buying a put option, you have the right to sell shares at the strike price. In our example you can sell it at $420.
When selling a put option, you have to buy the underlying stock at the strike price. In our example, we would have to buy 100 shares of AAPL at $425.
If AAPL closes below $425, our loss is the difference between the strike price of $425 and the price of AAPL on expiration day. If we didn't buy the $420 put, then our risk would be unlimited since theoretically AAPL could go to $0. However, by buying the $420 put, we can sell AAPL shares for $420, and therefore we are limiting our risk. Since we collected $175 in premium and the max risk based on the strike price is $500, we have limited our total risk to $325 ($500 - $175 = $325) per option contract.
In our example, we've gone from unlimited risk on the trade to $325 simply by buying a put and creating a vertical spread.
NEXT PAGE: Straddles & Strangles
|pagebreak|Reason 2: Reducing Your Cost When Buying Options
In my blog post, Swing Trading Options - Part 1, I discussed the strategy of home run trades. I used the following example:
AAPL is trading around $440, and we think that AAPL will move higher and trade at or above $480 at expiration date (in 18 days). Therefore you could buy a call option with a strike price at $475 for a price of $1.24 = $124.
At the same time, you could sell a call option with a strike price of $480. The option is trading at $0.90, so you would get $90. The total cost for this option trade is now only $124 - $90 = $34.
You can still participate in the up move, but your profit potential is limited, since you could now buy AAPL at a price of $475 (regardless of how much higher AAPL is trading at expiration, but you have to sell AAPL for a price of $480, since you sold the call.
However, you reduced the cost of buying the option by $90, and instead of paying $124 per option contract, you would only pay $34.
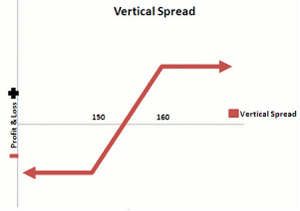
The picture above is known as a risk graph, and illustrates how a vertical spread works.
If the stock stays below breakeven (the strike price of the option that was bought + the total cost of the spread), the spread will lose money and the risk is capped at the amount that was paid for the spread. Once the stock trades above the breakeven point of the spread, the spread will start to make money (as seen on the right hand side of the risk graph), but the total profit plateaus and the max profit will be capped as well.
Strategy 2: Straddles and Strangles
When I started trading in 1989, I traded option straddles. The idea is to buy two options (one call and one put) of the same underlying stock (e.g. AAPL) with the same expiration date, but different strike prices.
When trading straddles, you think that the stock is about to move, but you don't know (yet) whether the stock prices will go up or down. I used to trade straddles ahead of major earnings report, since a stock usually moves only sideways before the earnings report is released, and then you hope that it will move sharply up or down after the earnings.
Here's an example:
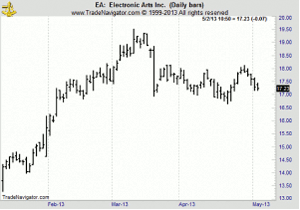
On May 7 (5 days from now) Electronics Arts (EA) will release its earnings report. The stock is currently trading at $17.25 (see chart below).
Let's say you expect some major news in this earnings report that should move the stock.
You could buy a call option with a strike price of $17.00 and buy a put option at the same strike price.
The call option cost $0.83 and the put option cost $0.59, so you would pay $1.42 * 100 = $142. Both options expire in 18 days.
NEXT PAGE: More Details of the Strategy
|pagebreak|If EA jumps to $21.00 at option expiration, you could buy 100 shares of the stock at the strike price of the call option at $17, and immediately sell it at the market price of $21. You would make $4.00 per share * 100 = $400. Now deduct your initial investment of $142, and you're still looking at a profit of $258 per option contract. In this example the put option would expire worthless.
If EA drops to $13.00, you could sell 100 shares of the stock at the strike price of the put option at $17.00, and immediately buy it at the market price of $13.00. You would make $4.00 per share * 100 = $400. Now deduct your initial investment of $142, and you're still looking at a profit of $258 per option contract. In this example the call option would expire worthless.
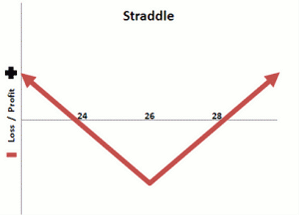
The chart below illustrates how straddles work.
As you can see, the stock has to move at least the amount that you pay for the spread, otherwise you lose money. In our example the breakeven points are at $17 - $1.42 (price of the option) = $15.58 to the downside, and $17 + $1.42 = $18.42 to the upside.
This strategy works best if you can buy the call and put option cheap and expect an explosive move before the options expire.
Trading an options strangle is almost the same as trading a straddle. The only difference is that you are using different strike prices for the call and the put option.
In our example we could choose to buy the $17.00 put option and buy the $18.00 call option. The put option costs $0.59 and the call option costs $0.38, so our total cost would be ($0.59 + $0.38) * 100 = $97.00
As you can see, our cost for this strangle is lower than the cost for the straddle.
Now let's calculate our break-even points:
Upside: Strike price of the call + cost of the strangle = $18.00 + $0.97 = $18.97
Downside: Strike price of the put - cost of the straddle = $17.00 - $0.97 = $16.03
Compare these to the break-even points to the straddle, and you will see that the break-even to the upside is higher ($18.97 vs. $18.42 for the straddle), but the breakeven to the downside is lower ($16.03 vs. $15.58 for the straddle).
You'll notice, if you are buying options it's important to buy the options as cheap as possible. The cheaper the options, the lower the break-even point and the faster you'll be "in the money."
That's why many charting software packages provide powerful scanners. When I was trading options back in 1989, I analyzed all options of the 30 stocks in the Dax with my Casio calculator. It took me around 1.5 hours to complete the analysis. These days you can analyze hundreds of stocks and options in a matter of minutes—sometimes even seconds—to find the cheapest options and the best strategy.
By Markus Heitkoetter, Founder and CEO, Rockwell Trading


