Price trends and patterns show the direction that the underlying stock is moving, and thus important to options traders, and Marcus Holland of Options-Trading.com shows how your strategy should be changed depending on the stock's trend.
While there are vital differences between options trading and trading in stocks, forex, or futures, there are also some similarities. One of them is that you should not simply enter an options trade without even a cursory glance at the price chart for the underlying asset.
Timing your entry using price charts can prevent costly mistakes.
The type of options trade and when you should enter it, for example, differ sharply between range-bound and trending markets.
Range-Bound Markets
A range-bound market is one where the
price of the underlying asset moves up and down over time with a clearly defined
upper and lower limit. At the time of writing the gold price is range-bound, but
over time most trading assets will spend quite a significant percentage of their
time trading in certain ranges.
Fig. 8.22(a) below is what the price chart for a typical range-bound market would look like.
In a scenario like this point A, where the market has reached its top and has started turning around, it would be ideal for one of the following options strategies:
a) Sell naked call options with a strike price above the top turning point of the range and an expiration date timed to coincide with the price reaching the bottom of the trading range. These will then expire worthless and the trader will keep the full premium of the options.
b) Buy ATM put options with the same expiration date as in (a) above. As long as the price movement between the top and the bottom of the range is sufficient to cover the cost of the options and more, the trader will make a profit at expiration.
At point B, the market has reached the bottom of the range and is starting to turn upwards. This is when the trader should enter into one of the following positions:
a) Buy ATM call options. Once again the expected price movement should be sufficient to cover the cost of the option in order to break even and start generating a profit.
b) Sell naked put options with a strike price below the bottom of the range and an expiration date timed to coincide with the market reaching the top of the range. These will expire worthless, providing the trader with a profit equal to the premium on the put options.
Trending Markets
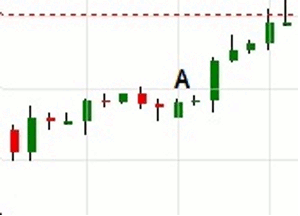
Fig. 8.22(b) shows a typical trending market.
At point A in this chart, the price has gone through a correction and started moving upwards again. At this point, the options trader's strategy would be directly opposite to the explanation at point A under range bound markets above. This is crucial to understand; the wrong decision here would result in one losing trade after the other.
Point A in a trending market is where strategies such as the following are recommended:
a) Buy call options, either ATM or OTM if it is fairly certain the option would exceed the OTM strike price by the expiration date.
b) Sell naked put options. The strike price should be below the previous support level to make sure the market doesn't surprise the trader with a sudden 'whip-saw'.
By Marcus Holland, Editor, Options-Trading.com


