
Overall, according to the technicals that he likes to use, the long-term trend in gold is still in play, says Matt McKinney of Zaner Group.
Fundamentally, Comex gold futures fell to $1210/ounce on December 6, 2014, and since then we have seen somewhat of a bounce higher. Well, actually the market since about December 3 until now has really been in a sideways type of trade. Despite the bearish fundamentals that have hit the market recently. For example, according to a Bloomberg news article written on December 16 titled, Gold Funds See Unprecedented 31% Slump With World Losing Faith. The first line of the article reads, “Investors are dumping gold-backed exchange-traded products at the fastest pace since the securities were created a decade ago, mirroring the steepest price drop in 32 years.” The article goes on to read, “Investors see less need for 'disaster insurance,' Fed Chairman Ben S. Bernanke told U.S. lawmakers on July 18. Traditionally, investors turn to gold in times of turmoil as an alternative store of wealth to equities and the dollar and as an inflation hedge.” Which again raises the question that I have been asking for months now. Is gold even a good hedge against inflation?
According to The Hightower Report, which I consider to be the best available fundamental futures and commodity news on all markets, it's more complicated than ever for gold futures. A Hightower Report dated December 11, 2013 stated, “In our opinion, gold is in the midst of a transition from being a safe haven currency surrogate instrument back into a classic physical commodity with a return to good old fashioned supply/demand tightness.” Well, better late than never, I guess. I have been writing about this for sometime now and even more than gold becoming a physical commodity traded on “old fashioned” supply and demand, I have watched it traded as a “riskier asset.”
To be truthful, from a fundamental standpoint, I haven't seen a market change so much so fast in all of my 15 years in the industry. I'm not sure how gold will trade fundamentally from one day to the next. I watch the market move up $30/ounce in a day then down $30/ounce in a day and never know why until after the fact when some trustworthy news source states a fundamental excuse for the move that seems convenient. Unless I follow the market technically. I believe in most markets that both fundamentals and technical are important. Not in the yellow metal, though. I find technicals are far more reliable than fundamentals.
Technically, on the daily February gold chart below, I have added some of my favorite technical indicators the nine-day simple moving average (SMA, red line), the 20-day simple moving average (SMA, green line), and the 50-day simple moving average (SMA, blue line). As well as Bollinger Bands (BB'S, light blue shaded area), volume, and candlesticks. The very first item that I notice from these technical indicators is that the bottom line of the Bollinger Bands (BB's light blue shaded area) has gone from pointing lower to sideways along with the nine-day SMA (red line).
However, the market itself on this daily gold chart is still in a downward trend, just not a super-trend down. The reason my technicals tell me the market is in a downward trend is solely due to the 20-day simple moving average (SMA, green line). This indicator is pointing lower on a sharp, steep angle and the gold market itself is trading below the indicator. In fact, the market actually closed right on the nine-day simple moving average (SMA, red line). For what it's worth it is this nine-day simple moving average that can't really make up it's mind. One day it's pointing down, the next it's pointing up. That leaves a sideways trending indicator and the same goes for the bottom line of the Bollinger Bands (light blue shaded area). That leaves three out of five indicators pointing down and two pointing sideways. The 20- and 50-day simple moving averages (green and blue lines, respectively) are pointing lower on good sharp downward angles. So is the top line of the BB's (light blue shaded area). The two sideways trending indicators are the nine-day SMA (red line) and the bottom line of the BB's (light blue shaded area).
NEXT PAGE: Gold Futures in Long-Term Downtrend
Finally, from my technical point of view, these indicators that I love so much have carved out clear-cut support and resistance lines. On the resistance side, the first area is the 20-day SMA (green line), the second area is the top line of the Bollinger Bands (light blue shaded area), and the third area is the 50-day SMA (blue line). The key support is the bottom line of the BB's (light blue shaded area). For what it's worth, I do believe this trend down will continue over the coming days and weeks. This is just my opinion based on my favorite technical indicators on this daily gold futures chart. Only time will tell where we go from here.
Daily February Gold Futures Chart
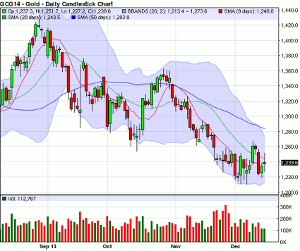
Click to Enlarge
Technically, on this monthly gold futures chart below, I have also added some of my favorite technical indicators. They are the nine-, 20-, and 50-day simple moving averages (SMA'S), Bollinger Bands (BB's, light blue shaded area), and candlesticks. These indicators tell me that gold futures are in a mid-to-long term “super trend” down. I say this because the nine-period SMA (red line) has crossed under the 20-period SMA (green line) as both SMA's are pointing lower on very sharp angles AND the market itself is trading below the nine-period SMA (red line).
The nine-period SMA is now, according to my technicals, the first area of resistance on this chart. The second area of resistance is the 20-period SMA (green line). Finally, according to my favorite technicals, the top line of the BB's (light blue shaded area) is the final area of key resistance. It is also important to point out in my opinion the fact that the 50-period SMA is pointing higher on a nice slow steady slope. This 50-day SMA could also at some point act as resistance also. Remember no technical indicators work 100% of the time. If they did I would be writing this article from my private yacht somewhere near Fiji perhaps. Instead I will have to settle for my desk overlooking the Chicago River. Remember, this is just my opinion based on my favorite technical indicators on this monthly gold futures chart. Only time will tell where we go from here.
Monthly Gold Futures Chart
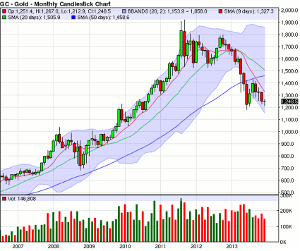
Click to Enlarge
Option Play
It is also important to note that trends can and do change at the drop of a dime with no warning whatsoever. So for those physical bullion buyers, in my view, buying gold on any sort of dip or pullback such as we are seeing now could work out very well in the long run. However, for options on futures over the next 45-120 days, I remain bearish.
Well, if the gold futures market continues to be in a long-term “super trend” down on the monthly chart and in a downward trend on the daily chart there could be an abundance of potential option set ups in my opinion. Everything from buying puts in a 3 to 1 ratio with a specific hedge with protection to selling calls with unlimited risk. If the market trends sideways we can still sell calls, but that requires a very well-funded account, has unlimited risk, and is not for everyone.
By Matt McKinney of Zaner Group


