Matt McKinney of Zaner Group offers some trade ideas, based on the battle between corn futures’ daily vs. monthly charts.
Fundamentally, according to a Bloomberg article from February 21st, "Farmers will see corn yields jump 4.1% this year, producing a record 13.985 billion bushels, the USDA said today in a report." That seems like a bearish statement for corn futures. The article also talked about stockpiles growing and some broker in Iowa expecting prices to "sag" again. Well, if I look at a short-term daily chart, I can't for the life of me understand anything that remotely looks "sagging."
On the other hand, from the bullish view, the extreme weather pattern this year in the United States has been hard to explain. Whether it's the devastating drought in California, the blizzards in the south from Atlanta to Oklahoma to North Carolina, or the gazillion "polar vortexes" that have slammed the Midwest with sub-zero temperatures. So who is to say that we won't have the same type of extremes this spring and summer whether it be droughts or floods.
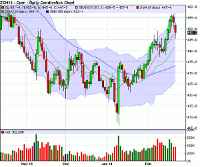
March Daily Corn Futures Chart
Technically, I have placed the 9-, 20-, and 50-day simple moving average (SMAs), Bollinger Bands (light blue shaded area), and candlesticks (red and green bars where each bar represents a day). These are my favorite technical indicators because they tell me so much about the market itself.
The very first item that I notice is that the March corn futures are in what I refer to as a "super-trend" up. The reason for this is first; the 9-day SMA (red line) crossed up and over the 20-day SMA (green line) back around January 22. The next two ingredients for a complete " super-trend " up occurred at around February 3 when both the 9- and 20-day SMAs (red and green lines) both started to point higher on sharp angles AND the market itself began to trade above the 9-day SMA (red line) and we've been trading in that “super-trend” since then.
Also, my favorite technical indicators point out on this chart clear-cut areas of support and resistance. The first area of support is the 9-day SMA (red line), 2nd is the 20-day SMA (green line), 3rd is the 50-day SMA (blue line), and the final area of support according to these technicals is the bottom area of the Bollinger Bands (light blue shaded area). The resistance is the top line of the BB's (light blue shaded area), where the market has been spending most of it's time lately.
On this chart below as we saw back in the middle of February we are seeing the market really test the first area of resistance, the 9-day SMA (red line). It actually traded below the 9-day in fact only to "pop" back up above. So for the time being I will say the "super-trend" up is in full effect as long as the 9-day SMA (red line) holds as real support like it did back in February, but we'll see.
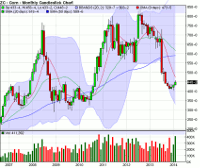
Monthly Corn Futures Chart
Surprisingly, I have added my favorite technical indicators to this monthly corn chart below. Again, they are the 9-, 20-, and 50-period simple moving averages (SMAs), the Bollinger Bands (light blue shaded area), and candlesticks (red and green bars where each bar represents a month).
Technically, the first detail I notice, and by far the most important component, is that the corn market is trading belowthe 9-period SMA (red line) as the 9-day SMA has crossed down and under the 20-day SMA (green line) while both indicators are pointing lower on sharp angles as the market itself trades below the 9-day SMA. This constitutes a "super-trend" down in my book on this monthly chart below.
Well, the tale of two technical stories now in the corn futures are that we have a short-term "super-trend" up on the March daily chart and a long-term "super-trend" down on the monthly chart. The first area of resistance on the monthly corn chart below is the 9-period SMA (red line) is at about $4.74/bushel, and since I believe the long-term trend will win out here in about another 25 cents or less, the short-term trend could run out of steam and the market could head lower on the daily too.
Remember no technical indicators work 100% of the time and this is just my opinion based on my favorite technical indicators on these daily and monthly corn futures charts. Only time will tell where we go from here.
Since, I believe that this "super-trend" up on the daily corn chart will run out of steam and the long-term "super-trend" could cause the short-term trend in corn to head lower, I like a number of different option plays. One of the several ways to play this market with options could be to buy straight put options or bear put spreads in a 3 to 1 ratio with a call for a hedge or "insurance" in case the trend continues higher and doesn't reverse in the short-term.
Another potential play could be to sell naked options or option spreads, again with protection maybe in the form of a futures contract or with other option plays. Remember, when you sell naked options you have unlimited risk and should have a "well funded" account of risk capital.
By Matt McKinney of Zaner Group


