In all kinds of trading, we have to assess risk and potential reward on every trade, so we don’t take a trade that would be a poor use of our funds, saysoptions expert Russ Allen of Online Trading Academy.
Being able to select trades that pay enough to be worth the risk is what separates the traders from the former traders and trader wannabes. In trading most instruments, the risk and reward calculations are straightforward. How many dollars do I make if the stock (or futures contract or forex contract) hits my target? How many do I lose if it hits my stop?
In options trading, though, there are some unique challenges. Fortunately, technology gives us the tools to meet them.
When we enter an option position, we are hoping to take advantage of one or more of the three forces that move option prices. These are:
- Changes in the Price of the Underlying Asset
- The Passage of Time
- Changes in the Option-Buying Public’s Expectations About the Underlying Asset
All three of these forces are at work at all times on every option. They push and pull, sometimes together, sometimes against each other. Figuring out our risk and reward requires that we take into account all of them.
Here is an example. On April 24, the equity indexes were trying to decide whether to break to the downside or not. It seemed, for a variety of reasons, that that had a pretty good chance of happening. If it did, bearish trades would work out. That day Allegheny Technology (ATI) showed up on a scan for stocks at the lower end of their recent range of implied volatility.
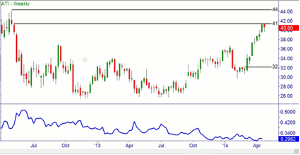
Below is the chart:
ATI was up against a major supply (resistance) level in the $41-44 area, and seemed to be running out of momentum. If the expected break in the market happened, there were no real obstructions to its dropping all the way back to around $32 within a couple of months. Its implied volatility, at 29.82% was almost at its lowest point for the past year. This looked like an opportunity for buying put options.
Our proposed trade was to buy puts at the $45 strike and to be prepared to hold them for about two months. Since it’s not a good idea to own options that are in the last two months of their lives, we needed an expiration date at least four months away. Our choices were July or October, so we focused on October. By buying options with a lot of time to go, and planning to sell them while they still had a lot of time to go, we would minimize the effect of time decay.
If ATI exceeded its previous high of $44.35, we would throw in the towel.
With our entry, stop, and target prices worked out, the next step was to calculate potential reward and risk. For that, it’s necessary to have option graphing software. There is no substitute for it.
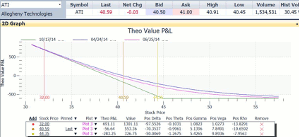
Below is the option payoff graph for the October 45 puts.
The blue P/L curve is as of the day of putting on the trade. The magenta line is as of two months in the future, on June 25. The vertical lines at $44.35 and $32 mark our stop and target prices, respectively.
In the table below the graph, the “Theo P&L” column shows what the profit or loss is estimated to be at each price marked by the vertical lines.
NEXT PAGE: Calculating Risk vs. Reward
|pagebreak|The reason for plotting the curve as of June 25 is to take into account the time decay that will occur in the two months we plan to hold the options. Notice that at every point on the curve the magenta line (P/L as of June 25) is only slightly below the blue curve (P/L as of today). This demonstrates that using options far out in the future results in very little time decay in the early days of their lives.
The “Theo P&L” column in the table shows that at our target price of $32.00, our profit would be $691.11; while at our stop price of $44.35 our loss would be $283.25. This is a reward to risk ratio of 691/283, or about 2.4 to 1. This is marginal at best. We prefer a reward to risk ratio of 3 to 1 or better.
Before we pass on this trade though, we need to take volatility into account. If it did come to pass that this stock dropped substantially, we would expect implied volatility to rise. People pay more for options when they are afraid of a downturn—and they usually become afraid of one only after it’s already underway.
We looked at this stock in the first place because it appeared on a scan for stocks at their volatility low points. While ATI’s implied volatility (IV) is just 30% now, it has been as high as 42% in the last year, and much higher before that. If a significant downturn did develop, it could easily reach 42% again.
An IV reading of 42 would be 40% higher than the current reading of 30. The next order of business was to see what a 40% increase in IV would do to this trade.
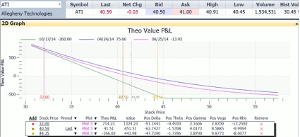
Below is the graph after cranking in a 40% increase in IV.
At those volatility levels, our maximum profit increases to $714.23 at our $32 target. Our loss at our $44.35 stop becomes just $166.02. Our reward/risk is now 714/166, or about 4.3 to 1. This is a much better proposition.
However, the correct comparison is the $714 profit that we could get if the volatility change does happen (best case), to the original $283 loss at our stop if the volatility change does not happen (worst case). So the real reward/risk ratio is $714/283, or 2.52 to 1. Close but no cigar.
In summary, we examined a proposed trade that had possibilities as a bearish bet on a stock at a major resistance level. We took into account the likely amount of a drop in the stock price, compared to the distance from the current price to the resistance level. In terms of the stock price alone, the ratio seemed favorable.
Next we estimated the time frame in which that drop could be expected to happen. We calculated what our P/L on the option trade would be at that future time, so that time decay was properly accounted for. Finally, we factored in the estimated effect of a likely increase in implied volatility. With that done, we could get a good reading of the best-case reward vs. the worst-case risk. In the end, the trade was marginal, so we passed this time. But that doesn’t mean the time was wasted. A marginal trade that we don’t take lets us move on to a better one. Without doing the full analysis, we might well have taken a trade that would be a poor use of our funds.
By Russ Allen, Instructor, Online Trading Academy


