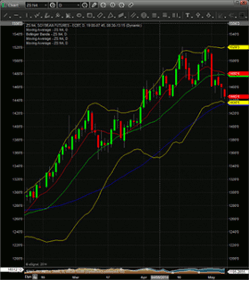
In his view, July soybeans look like they might be setting up for a double top, so Matt McKinney of Zaner Group offers some option trade ideas.
Fundamentally, I believe this market remains extremely vulnerable to a sell-off during this planting season. Right now according to a Hightower report (5/7/14) that stated "The transition from a very tight old crop situation to an abundant supply situation for the new crop season could keep the market in a long liquidation selling trend. Keep in mind; traders see 2014/15 world ending stocks near 80 million tonnes, which would be a record high and exceed the previous record high by about 10 million tonnes." The article also talked of China auctioning off some of their State Reserves which is certainly negative on prices in my view.
Technically, I have added some of my favorite technical indicators to this daily July soybean chart below. They are the 9-, 20-, and 50-day simple moving averages (SMA'S), the Bollinger Bands (yellow lines), and candlesticks (red and green bars, each representing a day). I happen to like these indicators because they can literally tell me dozens of important details and they can do this on any time frame and any market.
The first feature of this daily soybean chart that pops to me is the fact that we have somewhat of a potential double top set up. With the market starting a rally on February 3 at about $12.48/bushel and rallying all the way up to a high of about $15.20/bushel on April 17, then pulling back to a low of about $15.29/bushel on April 23 only to pop back up to retest the previous high at about $15.19/bushel only to fail and fall to our low of the day so far at about $14.41 bushel.
Now if this double top comes to fruition, we could have a long way to go to the downside in the soybeans. In fact, to complete the double top we would need to trade back down to that February low of about $12.40/bushel in the next 2-1/2 months. Who knows that could be far fetched, but I can see from where we are now.
I also wanted to point out that we have fallen below some very critical areas of support according to my favorite technical indicators. In face we have breached the 9-day SMA (red line), the 20-day (SMA), and now we are holding right at the support of the 50-day SMA (blue line). If we fall below that, then how low can we go?

Chart by ESIGNAL
Click to Enlarge
Option Play
I believe this is an opportunity, of course not without commensurate risk, to buy put options or bear put spreads in a 3 to 1 ratio with a call as a hedge for "insurance" in case soybeans rally and move up sharply.
I also believe this could be an opportunity, of course not without commensurate risk, to sell deep out-of-the-money call options and collect premium.
By Matt McKinney of Zaner Group


