
Russ Allen of Online Trading Academy outlines the three-dimensional nature of trading options and the powerful option payoff diagram tool that helps traders better visualize the profit picture.
When trading options, we are dealing with an instrument that is much more mathematical than other things like stocks and futures. Those are single dimension instruments. Their prices go up, and they go down. Options have three dimensions. They are moved by changes in the underlying stock. But, in addition, they change due to time and volatility. Visualizing the options profit picture is therefore more challenging.
Fortunately though, we have a powerful tool to help us with this. This is the option payoff diagram, also sometimes called the risk graph. This tool helps us to visualize how the value of an option position would change in response to all three of these influences. This is an invaluable aid in creating profitable positions. In fact, that task is pretty nearly impossible without it.
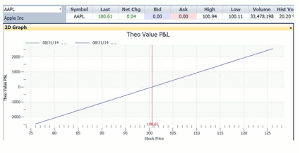
Here’s how it works. First, let’s look at a payoff diagram for a simple stock position. Below is the diagram for the stock of Apple.
Figure 1—Payoff diagram for (AAPL) stock—long position.
Click to Enlarge
Across the bottom of the chart is the scale showing different stock prices for AAPL. Tuesday AAPL closed at $100.61 per share. The vertical red line marks this price.
The vertical scale, labeled on the left as “Theo Value P&L,” is the profit or loss on a 100-share stock position, assuming that you bought it at the present price.
The blue diagonal line plots profit or loss at any stock position. The blue line crosses the red line where stock price equals the current price of $100.61, and the value for theoretical profit or loss is zero. This indicates that Tuesday, Wednesday, or at any other time, if the stock price stays at our cost, we would have zero profit or loss.
As we move away from that intersection toward the right, we are moving to higher stock prices. At those higher prices, our profits rise as well, so the blue line slopes up. For every dollar AAPL moves above our cost, we make $100 on our hundred shares. And if AAPL’s stock price goes down (leftward on the graph), we have a loss of $100 for every dollar (the blue line goes down to lower P&L values).
A line that slopes in this direction (upward to the right) is said to have positive slope. On payoff graphs, positive slope means that higher stock prices lead to higher profits—in other words, a bullish trade.
Until we get accustomed to it, one odd thing about this chart is that price is read left to right, instead of up and down. Another is that time is completely absent from the chart. This is not a record of what has happened to price over time. It is a projection of what will happen to profit, at any price, regardless of time.
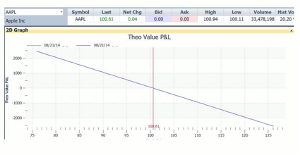
To help further with visualizing in this way, look at the chart below. It is also a payoff graph for AAPL stock, but this time for a short position. If we were to sell the stock short, we would make money if it went down, and lose money if it went up.
Figure 2—Payoff diagram for AAPL stock—short position.
Click to Enlarge
Now the blue line slopes in the opposite direction—downward as stock prices increase from left to right. This is called negative slope. It indicates that higher prices (rightward movement) lead to lower profits (lower P&L values on the vertical scale). In other words, negative slope indicates a bearish trade.
NEXT PAGE: Payoff Diagram for a Call Option
|pagebreak|
These are the simplest possible payoff diagrams. The slope is one to one, either positive or negative, over the whole chart. One dollar price change leads to one dollar difference in P&L, per share.
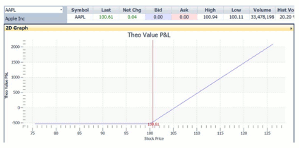
Now let’s look at the payoff diagram for a call option. Let’s say that we were to purchase a call option that gives us the right to buy 100 shares of AAPL at a fixed price of $100 per share, good for three months. As of Tuesday, such options were available for $5.30 per share ($530 for a 100-share contract).
Here is the diagram for that $100 November call. It shows the profit or loss as of a particular moment in time—the moment when these options expire on November 21.
Figure 3—Payoff diagram for AAPL $100 call option—purchased for $5.30.
Click to Enlarge
Now the blue line is not just a straight diagonal line. On the left side of our $100 strike price, the blue line is flat, at a P&L value of minus $530. This means that if AAPL is below $100 when the call options expire, we would lose the entire $530 cost of the option.
If AAPL is above $100, then the right to buy it at that price represents a discount to market value. Since there will be no time left for market value to change any further, the call at that point will be worth exactly the amount of discount that it provides. In other words, the call will be worth exactly the amount by which the price of AAPL exceeds $100. If AAPL is $106, then the call will be worth $6, and so on. There is no limit to the amount of profit that could be made, since there is no limit to how high the price of AAPL could go. So the line continues up and to the right to infinity.
Notice that the blue line crosses the zero P&L level where the stock price equals $105.30. This is because AAPL would have to be above the $100 strike price by at least our $5.30 cost for us to make any money.
So a quick glance at this graph tells us several things:
- This is a bullish trade. The positive slope indicates that.
- The trade has limited risk. The lowest point on the graph is at a loss of $530. Since the graph is flat and does not go any lower, that is our maximum loss.
- The trade has unlimited profit. Since the line slopes up and runs off the chart, there is no limit to potential profit.
- The break-even price is $105.30. We can see this because the blue P&L line crosses zero at this stock price.
All of this is instantly visible from the graph. If we add in our opinion as to where we believe price will be in the next three months, then we have a powerful tool for visualizing our profits.
By Russ Allen, Instructor, Online Trading Academy


