Options instructor Russ Allen, of Online Trading Academy, follows up his recent article about option payoff graphs—in which he looked at projected profit or loss at different dates—with a simpler option graph discussion considering only the profit or loss at expiration.
I recently wrote about using option payoff graphs to help visualize an option position. We’ll continue that discussion today.
In that article, which you can read here, I looked at projected profit or loss at three different dates; now, at expiration, and some time in between. This points out that an option’s value changes over time.
But for today, let’s back up to a simpler option graph considering only the profit or loss at expiration. For this example, look at this chart:
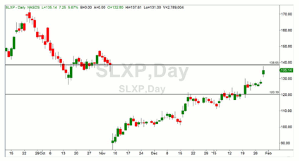
Salix Pharmaceuticals (SLXP) had rallied up into an area that was the origin of a big down gap in November. The news Tuesday was that some issues raised in an annual audit had been settled and earnings were to be restated for last year. The change in earnings was not as bad as had been feared and the stock popped up.
It was quite possible that there were unfilled orders to sell SLXP near this level. Anyone who bought the stock at any time before the gap in November was now under water. They had never had a chance since then to sell at any price remotely close to their cost. Presumably, many of them would grab an opportunity to exit at that price. Thus, there seemed a good chance that SLXP would drop from this level.
One way to profit from such a drop would be to buy put options. They would increase in value if the stock dropped. They could then be sold at a profit. A reasonable target was around $120, the origin of a recent rally leg.
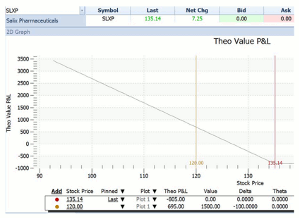
The March 135 puts were at $8.05 (option prices shown at the midpoint between the Bid and Ask prices). This diagram shows a single line that plots profit on this trade at any stock price, as of expiration day:
The line shows that—at lower prices of SLXP (further left on the graph)—profit would increase.
Note the table at the bottom. At the target price of $120.00, the Value column shows $1500. That means that the put that we bought for $805 would be worth $1500. The profit would be $1500 less our $805 cost, or $695. This is shown in the Theo P&L column.
If the stock did not move down, the put would become worthless and we would lose our entire $805. The first line in the table shows Theo P&L of -$805, and a Value of $0.00.
Here is the point I want to make for this week: for every option buyer, there is another trader who is short that option. Options do not come into existence until someone sells them short. The option seller, also called the writer, has a profit and loss picture that is the exact mirror image of the option buyer. What one gains, the other loses.
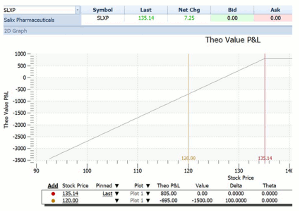
We can see this graphically (in both senses of the word) by creating a diagram of the trade from the option writer’s point of view. Here it is:
Notice that the option writer’s graph is quite literally the mirror image of the option buyer’s. If you drew a horizontal line across the first graph at the zero Theo Value P&L level and pivoted the graph around that line you would get the option writer’s graph.
In the table at the bottom of the second graph, note the same relationship. At the target price of $120.00, the Value column shows -$1500 here, where it showed plus $1500 for the buyer, so that the put that had been sold for $805 would now have to be bought back for $1500. The loss to the writer would be $1500 less the $805 received earlier for selling the put, or -$695. This is shown in the Theo P&L column.
But if the stock did not move down, the put would become worthless. In that case, the writer would retain the entire $805, which would be his profit.
It is clear that the writer of an option must lose for the option buyer to win and vice versa. Which side of that trade we want to be on depends on whether we believe that the stock will go down or not go down.
Although the graphs are symmetrical there are important differences in the situation of the two players.
- The option writer wins if the stock stays still. The option buyer loses.
- The option writer’s profit is limited. He can never make more than $805.00.
- The option buyer’s profit is unlimited. The lower the stock goes, the more he makes.
- The option writer’s loss is unlimited. He is the only source of the unlimited profits the option buyer might collect.
The above represents the situation if the amount paid by the option buyer ($805) is collected in full by the option writer. Of course, each side will pay brokerage commissions so their all-in P&L would both be somewhat worse than shown here. And in real life, if these were two separate traders (neither was a dealer/market maker) there would be another difference. The option buyer would pay the Ask price for the option while the writer would sell at a Bid price, which was lower. The difference would be kept by an option dealer/market maker. This difference could be large or small depending on how many traders besides the market makers were interested in the options for this stock. If there were many, then the dealers would be competing against those other traders for the deals and would not be able to maintain a wide spread. If few, the opposite would be true.
As you become more familiar with options, you will learn to think in pictures like these about your option trades. The more you learn, the clearer the picture will become.
By Russ Allen, Instructor, Online Trading Academy


