Options instructor Russ Allen, of Online Trading Academy, goes into further detail about the volatility cone in order to help option traders better understand how options work and how to use probability to their advantage when trading them.
In last week’s article, which you can read here, I began to describe the use of a terrific tool called the Volatility Cone. Today we’ll continue with that. If you haven’t read last week’s article previously, please read it first, as it is the first part of this discussion.
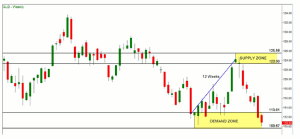
Our example had to do with GLD, the exchange-traded fund that tracks the price of gold. Here is how the price chart looked at the start of our example:
We were considering a bullish trade based on the demand zone in the $109-113 area, with a target around $123. Since that trek took twelve weeks last time it happened, we were estimating a similar amount of time for this trip.
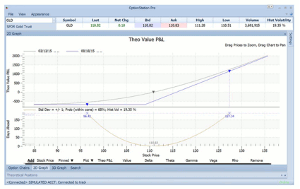
Last time, we created a theoretical option position involving the September $109 calls and plotted a P/L graph together with a Volatility Cone. That diagram looked like this:
The gold arc in the bottom half of the chart is the Volatility Cone. As previously described, it indicates a one-standard-deviation price range from $96.42 to $127.34 for GLD as of the September expiration date on September 18, 2015.
But what we wanted to know was whether it was reasonable to expect that our target of $123 could be reached in our estimated twelve weeks. We’ll continue to work that out now.
The P/L graph in the upper part of the chart above has two lines or plots. The horizontal axis is the price of the ETF, and the vertical axis is the profit or loss our position (long one September 109 Call) would show for any price of GLD.
By default, the blue plot with straight lines is as of the expiration date, and the gray curved plot is as of Tuesday. We can adjust the date of the blue plot forward (closer) until it and its cross-points on the vol cone are as of our twelve-week target date, which would be June 5.
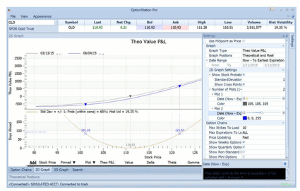
We make the adjustment in the Settings panel, under the 2D Graph Settings section, under Plot 1. We drag the Date slider to the left (to earlier dates) until the date reaches our 12-week target date, which would be June 5. The result is shown below. Note that the blue line is now curved, not straight; and that the legend at the top of the graph now shows a date of June 4, 2015 for the blue line.
The blue label on the right-hand cross point in the vol cone now reads $121.67, which means that the one-standard deviation, 68%-probable range, tops out at that price as of our June 5, 2015 target date.
Does that mean that GLD could only go to at most $121.67 and could not reach $123 by June 5? Of course not, it just means that going beyond $121.67 is pretty unlikely, under the assumption that GLD will move in the future with a volatility level that is similar to the recent rate.
NEXT PAGE: The Main Decision-Making Tool
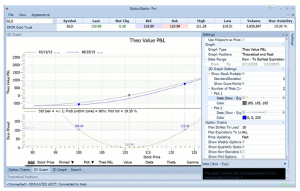
|pagebreak|If we want to see at what future date our target would fall within a 1-standard-deviation range and, therefore, be more likely to happen, that is easy to do. We just drag the Date slider for Plot 1 further to the right until the cross point reaches our $123 target. The closest we can get is $122.94. Here is the graph with that adjustment:
Very faintly, near the Days Ahead axis, we can see that this corresponds to a date of June 25, 2015. This is about three weeks further out than our 12-week estimate of June 5.
What this means is that it would be quite aggressive to expect such a move in 12 weeks, by June 5, but that it would be more reasonable to expect it to happen a few weeks after that. We need to select options that will still have at least two months of life remaining at our new revised target date of June 25. In other words, options that expire in August or later. If we had originally picked options with an expiration date earlier than August, we would now revise our plan.
So, in this case, our main decision-making tool, as it always should be, was the location of quality demand and supply zones. Secondarily, we did a probability cross-check with the Volatility Cone, which gave us the useful information that we should allow a few more weeks for this trade than we had originally estimated. This kind of information is crucial for options trades since one of our main decision points is the selection of an expiration date.
The Volatility cone has other related uses. For example, say that instead of a directional trade like this one, we were contemplating a range-based trade. In such a trade we sell options whose strike prices are outside of a price range within which we expect a stock or ETF to stay for a while. We would identify those strikes, once again, by locating a good demand zone below the current price and a good supply zone above it. The vol cone could then be used to confirm that those strike prices were, in fact, far enough away from the current price that they were unlikely to be reached by the options’ expiration date. Strikes more than one standard deviation away from current price should be the minimum in that case and more than two standard deviations would be even lower risk (remember that we would be selling options short in that situation and would want any options we sell to expire worthless).
I hope that these articles about probability have increased your understanding of how options work and how we can use probability to our advantage when trading them.
By Russ Allen, Instructor, Online Trading Academy


