Although the directional butterfly has several moving parts, options instructor Russ Allen, of Online Trading Academy, illustrates how it can be a good solution to gaining profit from a stock move at a reasonable cost and with limited risk and he cites a real world example for support.
Options give us some great ways to fit our trading approach to the current market conditions.
In a previous article we looked at a type of option spread called a directional butterfly. This trade is designed to make money if a stock moves in the direction we expect...no surprise there. What this spread does is to make it inexpensive to make the trade and limit our risk in case the stock moves against us.
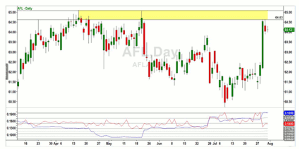
The opportunity we were looking at involved the stock of AFLAC (AFL) on July 30. Its chart looked like this:
We were looking at a bearish opportunity: we thought most likely that the stock would fail to break through its recent highs around $65.10 and could drop back to its recent breakout level around $61.50 within a few weeks.
As an alternative to selling the stock short, we considered a directional put butterfly which involved three components:
- Long one November $65 put—the moneymaker.
- Short two November $60 puts—the offsets. These reduced the cost of the trade and reduced our exposure to changes in volatility. They also nearly eliminated the effect of time decay that the $65 put alone would have suffered.
- Long one November $55 put—the protective unit. This very cheap option made this into a limited risk trade.
The total cost of this spread was $120 per 100-share unit including all four options. This was our maximum loss on this trade if we used no protective stops and held it for the whole four months.
Our plan would cut down that $120 risk considerably.
First, we would plan to exit the trade immediately if AFLAC traded above its recent high at $65.10. If that happened, it would indicate that our opinion about its inability to do so had been incorrect and there would be no more reason to be in the trade.
Second, we would not hold the trade for the full four months. If AFLAC hadn’t made its move within a month we would exit in any case.
Although setting stop-loss orders would not reduce the amount of cash required to enter the trade (it would still be $120 per 100-share lot), these two steps cut down our maximum risk from $120 to about $11 per spread. The profit potential if AFLAC hit our $61.50 target was over $44 per contract, four times the $11 risk.
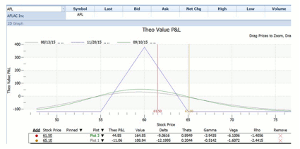
Below is the Profit/Loss graph of this position:
The horizontal axis is the stock price and the vertical axis is profit or loss on the position (given its $120 cost). The gray curved line shows P/L at any stock price if reached today. The green curved line shows P/L at any stock price in a month’s time.
We used today’s line (gray) to determine loss on the position at our $65.10 stop-loss price. The second row in the table above indicated that loss at $11.06 (in the Theo P&L column).
We used the green line, which indicates P/L a month from now, to determine our profit. This is because we believed it could take that long to reach our target. The first row in the table indicates the P&L at that price as $44.85. The profit could be a bit higher if AFLAC were to drop lower than our $61.50 target.
Although the directional butterfly has several moving parts, it can be a good solution to gaining profit from a stock move at a reasonable cost and with limited risk.
By Russ Allen, Instructor, Online Trading Academy


