
You don’t have to be a rocket scientist to pick great stocks with VectorVest, asserts Dr. Bart DiLiddo, mathematician with a PhD from Case Western Reserve, Sloan School of Management graduate at MIT and a Fortune 500 business background.
(Sponsored content) NPM stands for Net Profit Margin, a very important metric of financial performance. I wrote about it in three consecutive essays (Romancing the NPM, A Whole New Dimension, and The Comeback Kids) beginning on March 5, 2010.
Why am I writing about it now?
Head of the Fed, Ms. Janet Yellen, presented a surprisingly dovish stance on the Fed’s monetary policy to Congress this week. A September interest rate increase is most likely off the table because of weak inflation. And a December hike is not for sure. Stock prices surged higher on the news.
But wait a minute, weak inflation means there’s not much pricing power out there. And if you live on this planet you must know that costs keep going higher no matter what inflation does. So watch out. Profit margins are likely to be squeezed and companies that report lower profit margins are likely to get hammered.
The way to reduce the risk of owning stocks of companies that are likely to report thinner margins: check their NPM performance.
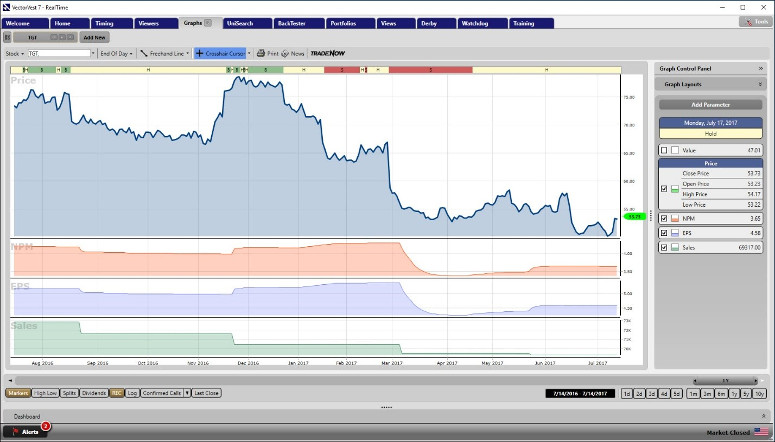
It’s very simple to do, but there are contingencies, such as seasonality factors. So, I like to look at graphs of the data. For example, let’s take a look at Target (TGT).
Access a 1-Yr, EOD, VectorVest Simple graph of TGT.
Delete the Stop-Price and RT.
Add NPM by clicking on Add Parameter, VectorVest Fields, scroll down to NPM, click on it and add it to the graph by checking the box.
Click on Add Parameter, Sales/Market Capital, Sales and add it to the graph.
 Click image to enlarge
Note that EPS and NPM track each other quite well, each ending the 12-month period much lower than they began and sales dropped each quarter. Is there any question as to why TGT’s price fell $20/share?
Note the rally in November 2016. Bargain hunters always jump in on the slightest hint of good news, such as the little pop in earnings at that time. Take a look at the 5-Year graph of TGT. It has struggled for a long time.
Click on Stock Viewer. Using the same graph settings, look at the top 10 stocks. Which three would you buy? Remember the NPM.
P.S. The moral of this essay is you don’t have to be a rocket scientist to pick great stocks with VectorVest.


