
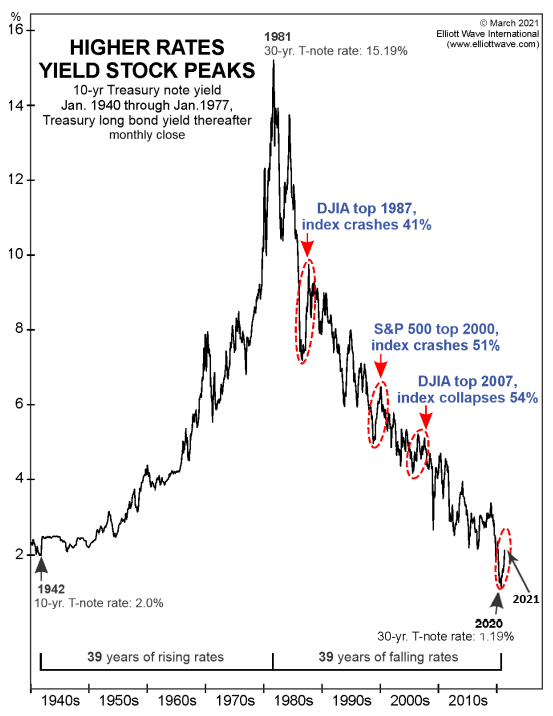
Sponsored Content - The chart below, which covers the yields for US 10-year and 30-year Treasury bonds from January 1940 to March 2021, was pulled from a March 4, 2021 Elliot Wave report.
The chart depicts the crashes for the Dow Jones Industrials (DJIA) and S&P 500 composite indices from 1986 to 2007, after the 30-Year US Treasury bond yields spiked.
The table below depicts the 30-year US Treasury bond yields, which preceded the DJIA 1987, S&P 500 2000, and DJIA 2007, 41% to 54% declines, which are depicted in the above chart. The declines were preceded by 21% to 43% increases for the yield of the US 30-year Treasury bond. The increases occurred within six to 16 months after the yields had troughed. Since August 2020, the US 30-year Treasury bond yield has increased by 110% from an all-time low of 1.16% to 2.40%.
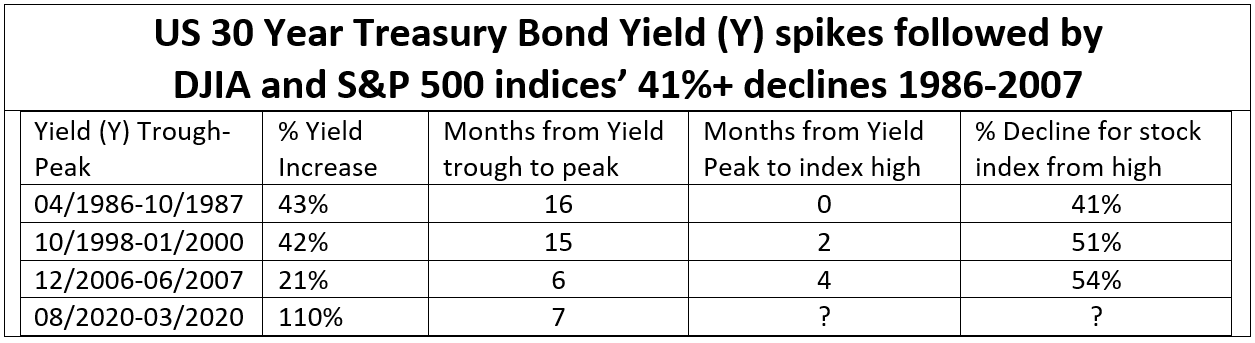
The October 1987 peak for the yield coincided with the infamous October 1987, Black Monday crash and 41% decline. In March 2000, two months after the yield increased to its January 2000 peak, the dotcom bubble burst and the result was a 51% decline for the S&P 500. The DJIA reached its pre-2008 crash high in October of 2007, which was four months after the yield had increased by 21% to its peak in June 2007.
The logical conclusion is that the 110% increase for the yield from August of 2020 to March 12, 2021, will result in a 41%+ correction for the DJIA and S&P 500 composite indices. The correction for the NASDAQ could be more severe. After the bursting of the dotcom bubble in March of 2000, the NASDAQ declined 77% from its high to its October 2002 low.
There are three logical reasons as to why spikes for the bond yields since 1986 have caused major corrections for the stock indices:
- Increasing yields have a direct negative impact on the real-estate industry. Home-mortgage rates are tied to the US 10-year bond yield, which also increases when the yield for the 30-year bond increases. Since there is a maximum monthly payment that a home buyer can afford, the price of houses has to go down when home mortgage rates increase. The higher rates also result in both the homeowner and the buyer becoming frustrated, which negatively impacts consumer sentiment.
- Institutional rebalancing. Institutional investors including pension funds, endowments, and life insurance companies, etc. have mandates, which require them to shift or to rebalance the bond and stock portfolio allocations when there is a significant change for interest rates. In a rising yield environment stocks are sold to purchase the additional bonds to maintain a portfolio’s stock/bond weighting.
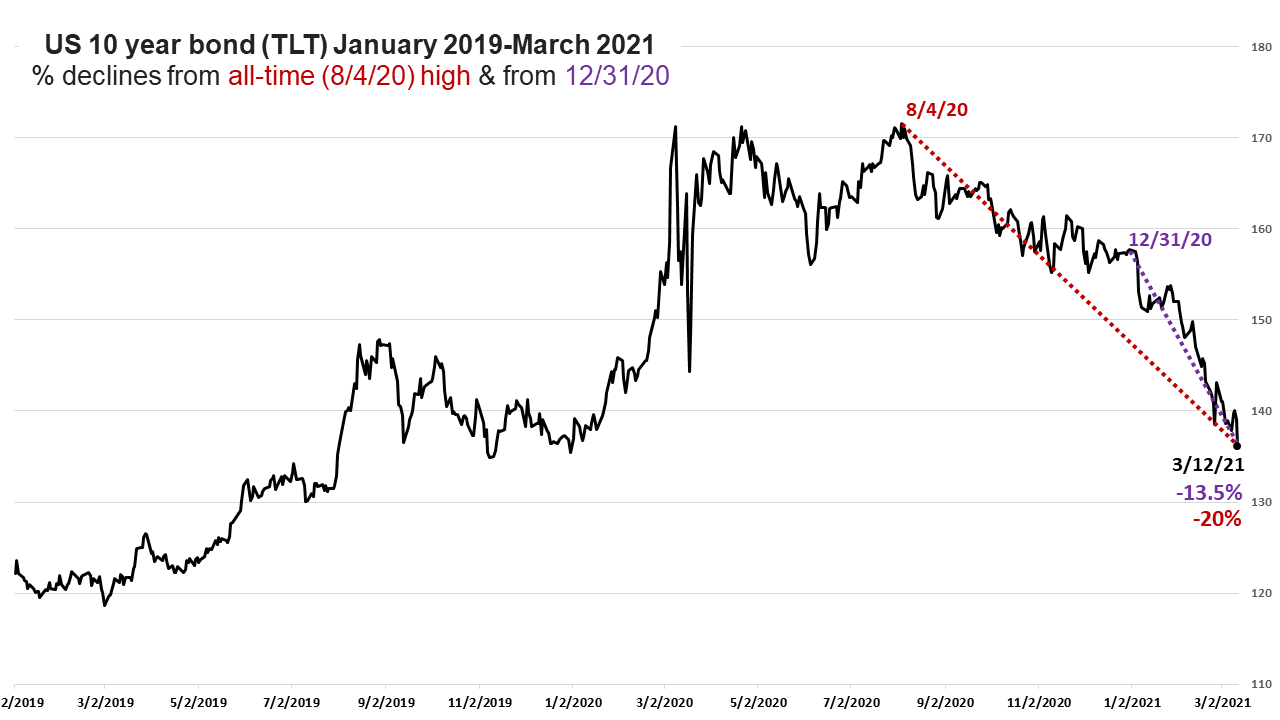
- Sticker-shock effect. The chart below depicts that the value of the 10-year bond (TLT) had declined by 20.0% from August 2020 through March 12, 2021. The decline since the end of the 2020 was 13.5%. Since most investors have Treasury bonds in their portfolios, they are rudely awakened when they receive their monthly statements, which reflect the overall value of their accounts declining. The sticker shock inevitably has a negative impact on the following:
- Consumer Spending and Sentiment
- Investor Sentiment
The minimum 41% declines for the major stock indices after the three yield spikes since 1987 fully support my recent discovery of the quantitative metrics, which constitute the DNA for a “perilous peak.” According to the DNA, the S&P 500 reached its fourth perilous peak since 1881 in 2021.
The perilous peak signifies that a market is at an historic high with a 100% probability for a minimum decline of 42%. The decline coincides with Elliot Wave discovering the 41% minimum declines after yields for 10-year and 30-year US Treasury bonds had spiked. The table below depicts the 42% to 86% declines for S&P 500 from the summits of its three prior perilous peaks.
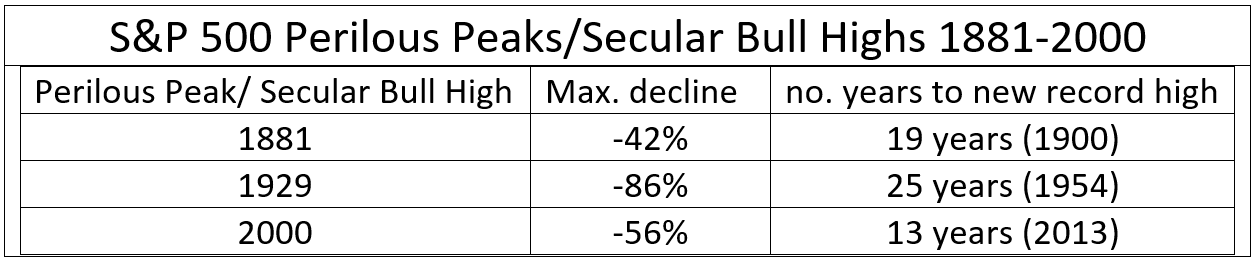
The above table also depicts that all of the S&P 500’s perilous peaks have coincided with three of the index’s secular bull highs, which include the 2000 secular bull high. The bottom line is that the S&P 500’s current set up is identical to 2000. The following have occurred for both 2000 and 2021:
- Perilous Peaks
- Secular Bull Highs
- Treasury Bond Yield Spikes
Based on the recovery to new high durations for the perilous peak/secular bull highs in the table above it will take a minimum of 13 years or until 2034 for the S&P 500 to climb above its 2021 summit.
For more about perilous peaks and also the fascinating “greed accelerator(s),” a key requirement which must occur before a high for a market can be classified as a perilous peak read my DNA Discovery Confirms 2021 Perilous Peak & Secular Bull High for S&P 500 article. Viewing the six-minute video clip from my perilous peak presentation at February 2021 Money Show, which is at bottom of page is highly recommended.
On Wednesday, March 17, 2021, 2:10 pm - 2:40 pm, I will be making a FREE 30-minute virtual presentation at The MoneyShow Virtual Expo. The title of my presentation is “Why It’s Critical to Know the Difference Between a Secular Bear and a Cyclical Bear Market.” The presentation will also cover why investing strategies, which are utilized during a secular bull do not work during a secular bear. The investing strategies, which work best during a secular bear will also be covered.
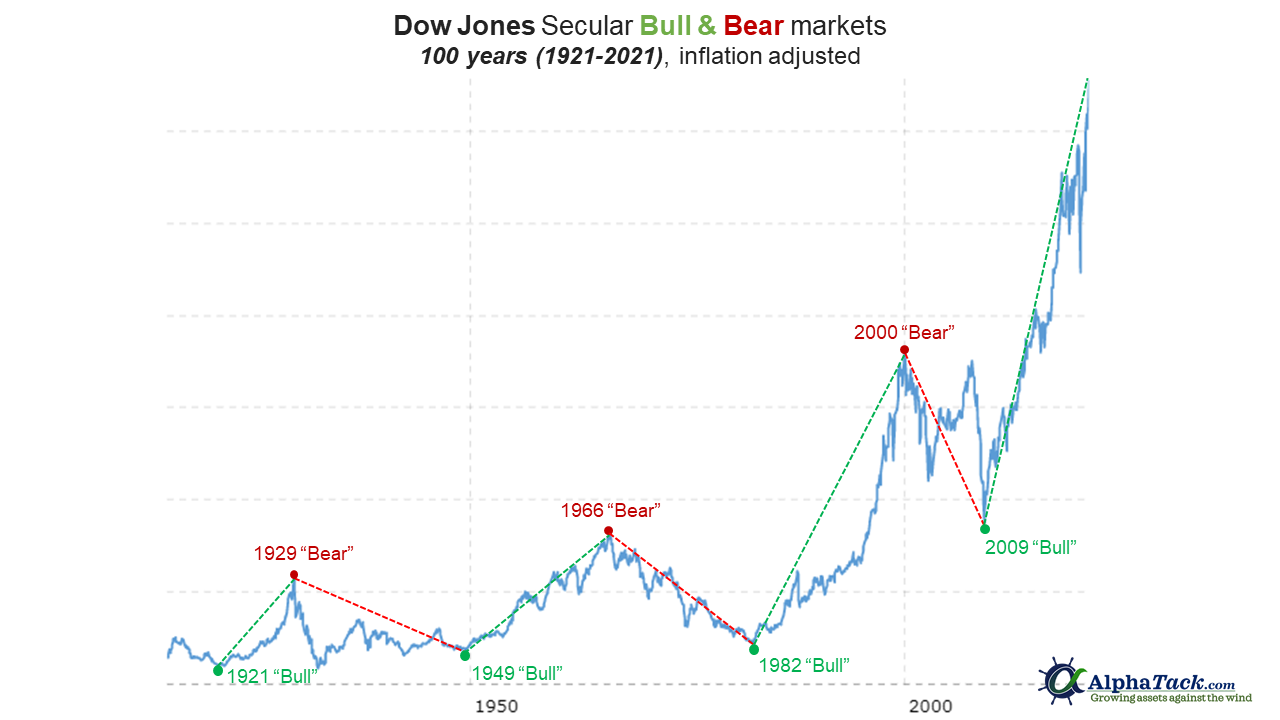
The Dow Jones 30 Industrials composite, the oldest US stock index has experienced eight secular bear markets since 1802. Each had minimum lifespans of eight years. This includes the most brutal secular bear, which began in 1929 and lasted until 1949. There has been an aggregate of more than 100 cyclical bear markets during the eight secular bull markets, which have occurred since 1815. The last cyclical bear, which began in February 2020 had a duration of nine months. The minimum lifespan of a secular bull market is also eight years. The chart below depicts the secular bulls and secular bears, which the Dow Jones has experienced over the last 100 years.
My MoneyShow presentation is scheduled from 2:10 to 2:40 pm on 3/17/21. To register to attend click here.
The video at this link is the six-minute clip from my February 2021 “S&P 500 at 4th Perilous Peak since 1881” Money Show presentation.


