
I want to thank those of you who sent me emails with questions and appreciation for the last series of articles.
Many of you have asked me to present a series of technical articles as opposed to the trading behavior commentaries I have been posting. Accordingly, here’s the first in a series of five articles about cyclical behavior in the capital markets.
Edward R Dewey, the so-called “father of cycles” (not to be confused with the Dewey decimal system used to catalog books) wisely stated that “cycles the mysterious forces the trigger events.”
We will examine the meaning of this seemingly cryptic statement as it applies to the capital markets and we will see how cycles can be used for investing and trading. First, however, let’s begin with a working definition of the term “cycle.”
I define the term “cycle” as a repetitive data pattern which occurs over time. In other words, when we talk about the 3-to-4-year business cycle we talk about a pattern that repeats approximately every 3 to 4 years.
Do not confuse a cycle with a sine wave. A cycle is not always symmetrical whereas a sine wave is. Sine waves are always exact repeating at predictable and regular intervals. A cycle is approximate.
Get Trading Insights, MoneyShow’s free trading newsletter »
There many different types of cycles: weekly cycles, daily cycles, seasonal cycles, yearly cycles, intraday cycles, and many more. Rather than approach this topic with a broad brush stroke I want to limit the definition and the application in order to achieve actionable and objective results. Therefore, this series will focus on specific time-based cycles in a variety of markets and sectors in order to demonstrate both the concept and its application for trading and investing.
Let’s begin with an example that is particularly relevant because it clearly demonstrates what is usually found in the relationship between cycles and fundamentals.
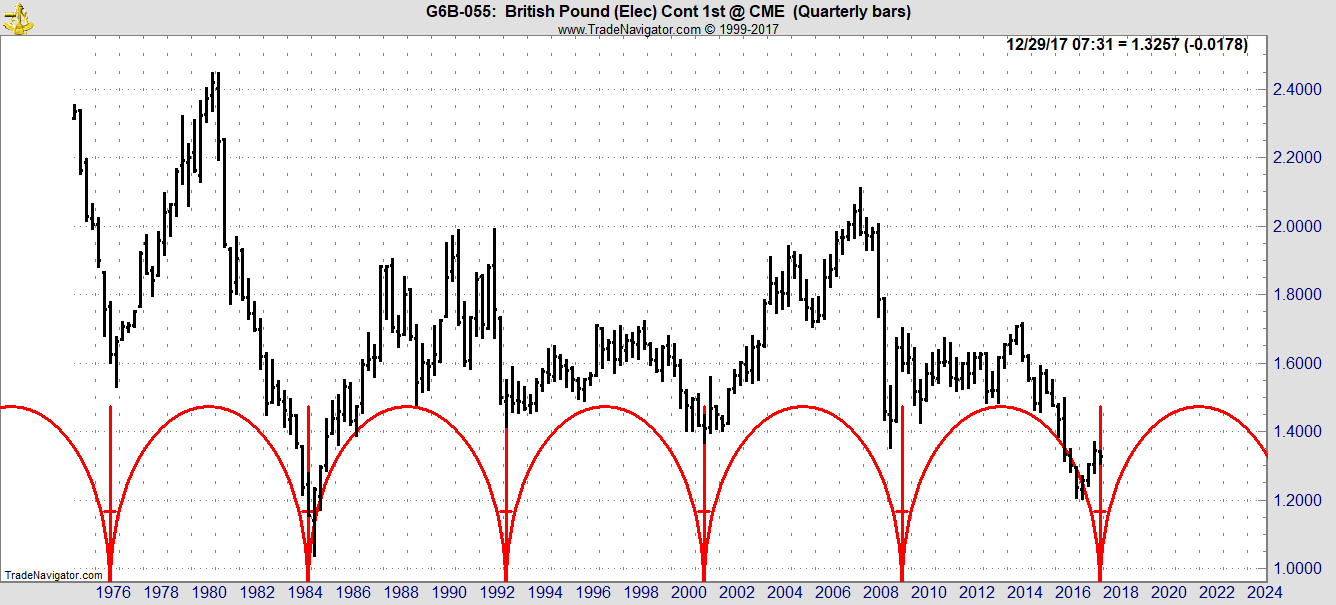
As you likely know, Great Britain has voted to withdraw from the European Union. Predictions for the fate of the English economy and the pound sterling are dire. It seems as if the news is consistently negative. And yet if we examine the price cycle of British pound versus U.S. dollar we find a fairly regular pattern of approximately eight years from one price low to the next as demonstrated in the chart below. How do we reconcile the fact that the news is negative and suggests lower prices while the cycle clearly suggests that a low is developing? Think about it until the next installment of this report.
Trade well and prosper
Subscribe to The Jake Bernstein Online Weekly Capital Markets Report and Analysis here…


