
There’s an old saying in poker, if you sit down at a table and can’t figure out who the mark is in the first hour, chances are it could be you. Financial markets have tells, yet most traders have little or no knowledge how to identify them, says Jeff Greenblatt.
I’m going to give you a short primer on how to do that.
Briefly, you know I’ve been talking about the balance bars in the Dow Jones Industrials (DJI). Last week the Dow set a low at 117-180-minute bars off the 26616 top. In my view, the top would be an extremely high probability confirm if that low were taken out. In a good market that wouldn’t have happened.
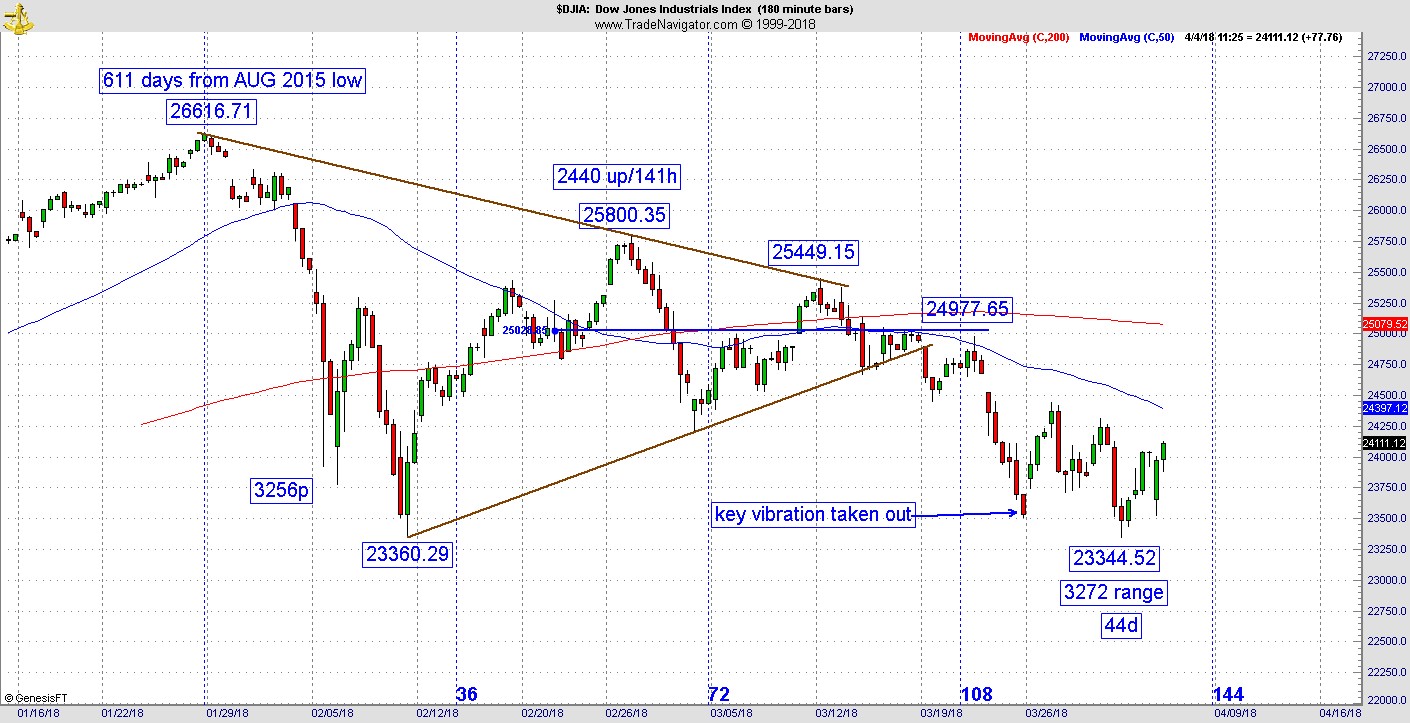
There was another square out that materialized on Monday at 44 days. In a good market, the Dow wouldn’t have been down 510 points at its low water mark Wednesday. So, we have a market not loving the bulls back.
There are many problems and we are likely scratching the surface. This is bear phase/market type activity. There it is, I said it. However, I am looking for a serious bounce attempt.
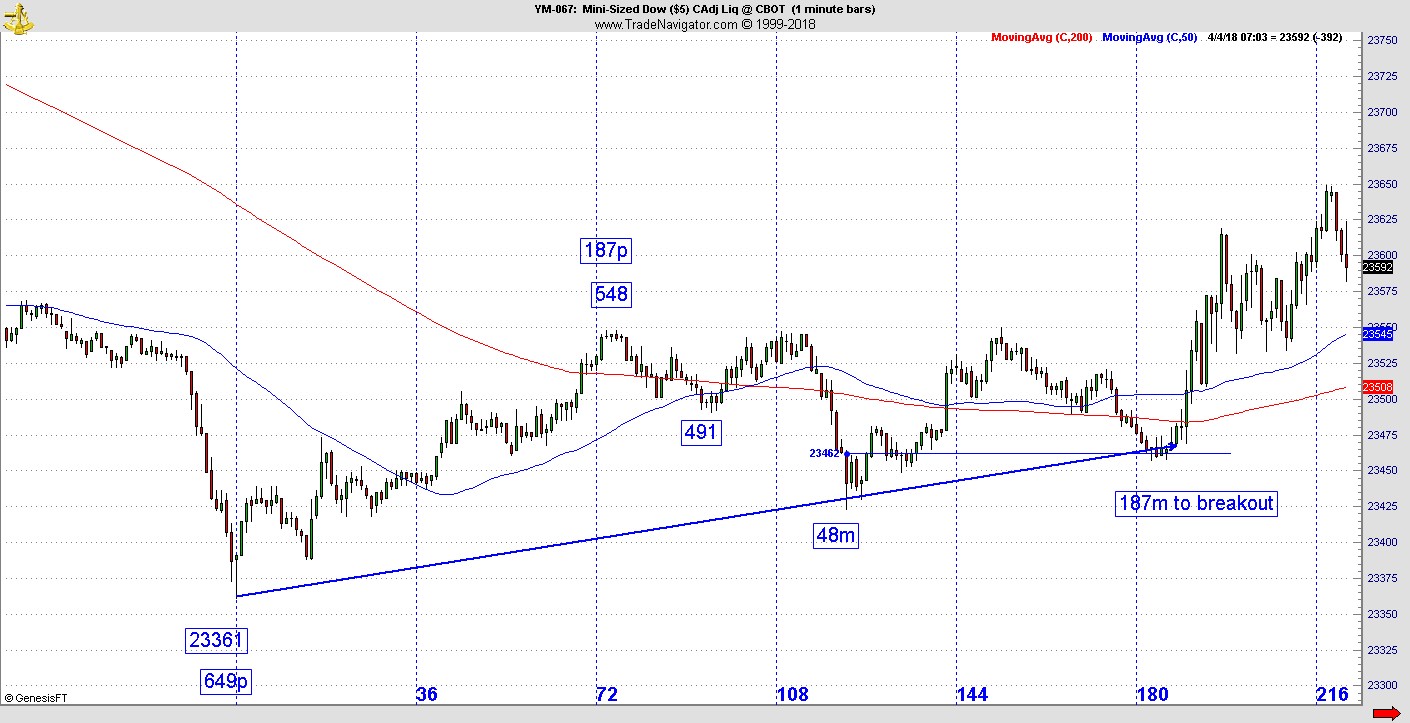
But with all this talk of balance bars, I wanted to show you a great example of how one developed Wednesday morning in the YM. In some of my recent trading strategy posts, I discussed how markets change direction and present opportunities by a square out vibration. Here we have an overnight low, a first leg up and a pullback. Later on, there is a breakout.
So, the first leg up is 187 points to 23548 or just 548. That steep pullback ends in 48 minutes. Yes, it can be that simple. The first leg up is 187 points.
Now go back to the low and extend out 187 minutes and you won’t find a low but a rounded bottom and the 188 bar starts the breakout which is the biggest move in the entire sequence. Let’s take this one step further.
Many of you have seen the Dow charts with the big balance line at 116 hours off the 26616 top. This is the same principle. The 48th minute bar becomes a balance bar and when you draw a line across the page from the top of the 48 bar, there is major support for the 187-bar breakout.
Is this a coincidence? There are no coincidences when it comes to financial markets. Everything happens for a reason, but standard technical analysis only covers price levels and the shape of patterns. It does not explore the mysteries of price and time squaring Gann taught nearly 100 years ago.
Where is the opportunity? Never front run the bars and always wait for the reaction to the square out. Any good book on candlestick methodology will reveal good reversal signals. We are combining modern candlestick formations with these vibrations.
This is a good teaching example, but the key question is how do you find these situations? To one degree or another, these tendencies repeat in stocks, futures, commodities and forex.
The tendencies appear in time frames ranging from a one minute to weekly/monthly. But they are tendencies which means they are like snowflakes. They are similar but no two are ever the same. It requires discipline and patience to wait for something like this to jump off the page. But most traders have been trained to sit on their hands and do nothing for hours anyway.
The challenge is some people who are exposed to this method don’t accept it’s the number square outs that are driving the bus. It’s too simple, they say.
That’s right, it is a simple concept but it’s not easy. It requires patience to wait for the square out to materialize. In this case, we know there was a 187 move at the high. That means one must wait 187 minutes for this square out to materialize.
Do we take all the square outs? The best ones materialize off tops, bottoms and the secondary pivots that go with them. Smaller legs usually spawn smaller scalping plays.
The first step is being exposed.
The next step is studying your archive charts and finding these opportunities on your own.
Finally, it is highly recommended when you are ready to try this out on a simulator first until you become comfortable you know what you are doing.


