
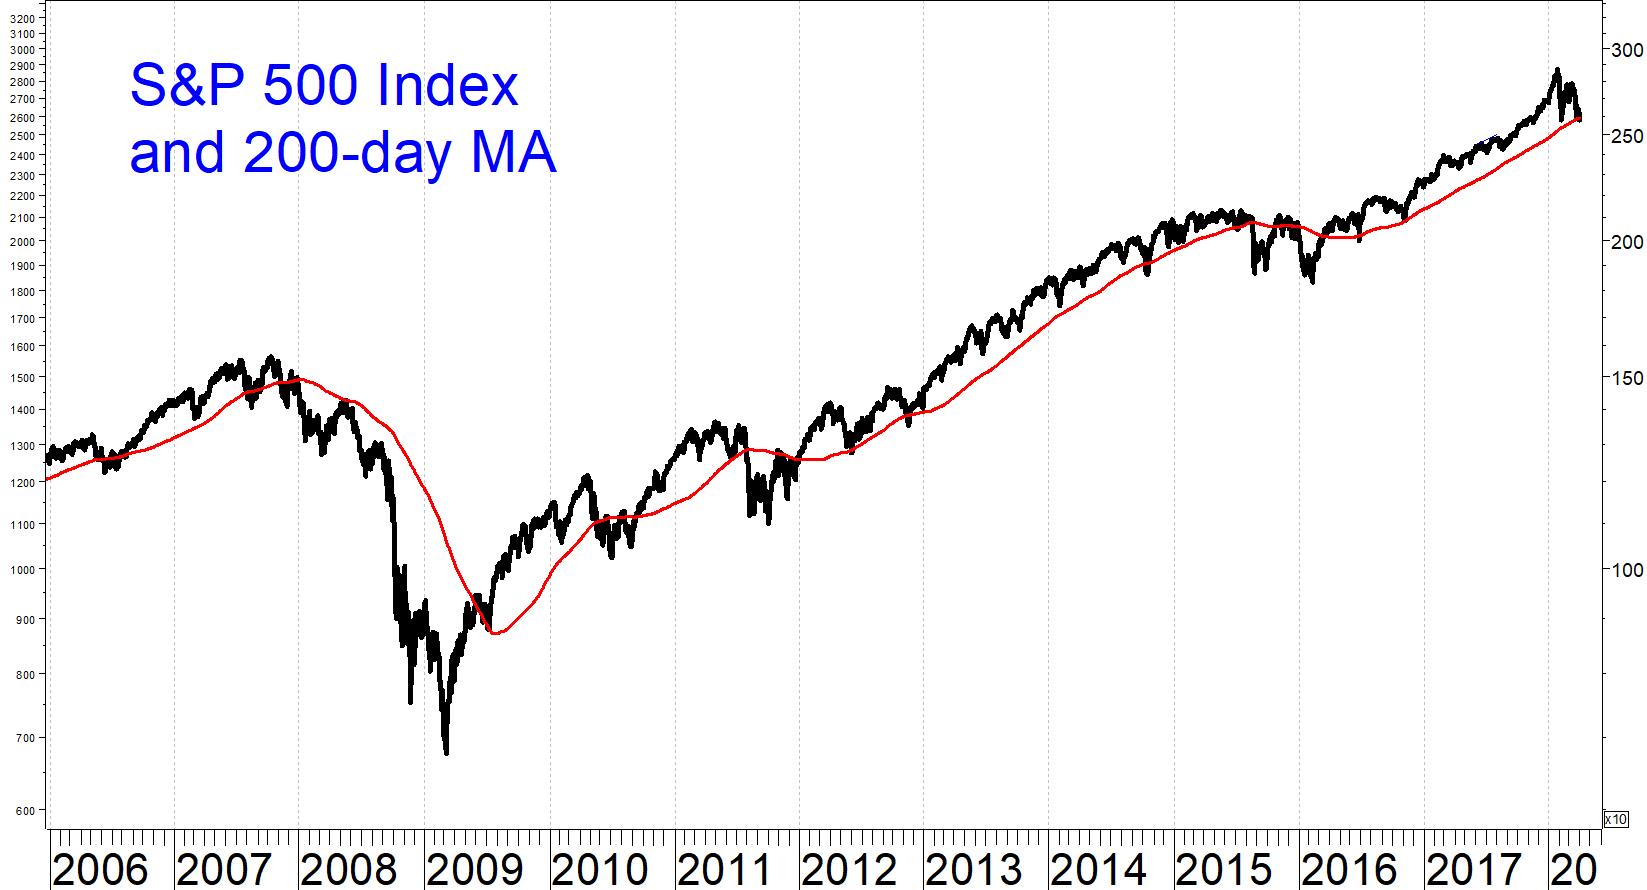
The February-March market decline brought the S&P 500 Index down to its 200-day moving average for the first time since 2016. Does history support the use of a crossing of the 200-day moving average as a trading system, ask Glenn Gortler and Marvin Appel, MD, PhD.
Some commentators (such as on CNBC.com) have viewed this development as potentially bearish.
The reason why this development hit the news is that many technical analysts have traditionally viewed the 200-day simple moving average as an indicator of the long-term stock market trend. The interpretation is that when the index is above this moving average the long-term trend is bullish, and when below the average the long-term trend is bearish.
An examination of the chart above (S&P 500 Index, price-only, and its 200-day moving average from 2006-2018) shows that the moving average has frequently served as support or resistance.
If you believe that crossings of the 200-day moving average has significance in predicting the long-term trend, you could use crossings of the moving average as a trading system, going long whenever the index is above its moving average, and being in cash (or short) whenever the index is below its moving average. This is the “basic system.”
Trading this way would have scored some big victories. For example, you would have been invested every day during the strong years 2013 and 2017, and you would have been out of stocks for all of 2008 and on the day of the crash of 1987. This, however, is merely anecdotal evidence.
Performance of the 200-day moving average trading system from 1960 to 2018
From Dec. 30, 1960 -April 2, 2018 if you had been able to trade an S&P 500 Index product you would have earned 6.75%/year trading based on the 200-day moving average versus 6.86% buying and holding.
This means that trading did not increase profits compared to buying and holding, even neglecting taxes and trading costs. However, trading significantly reduced risk from a worst drawdown of -57% for buying and holding to a worst drawdown of 28% trading. This system would have traded 174 round trips, or approximately three per year on average.
Note that these figures are for the S&P 500 Index price-only, counting neither dividends nor interest when in cash. Counting these income sources would have increased the relative performance of trading since for most of the time before 2008, 3-month Treasury bill yields were higher than the dividend yield of the S&P 500 Index.
An improvement to the 200-day moving average trading system
It turns out you could have achieved slightly better results if you delayed your sell signals by one day, moving from stocks to cash only after the S&P 500 Index had closed below its own 200-day moving average for two consecutive days. With this modified system, you would have earned 7.05%/year with a worst drawdown of 20%. The improvement in risk occurred in 2008. Requiring two consecutive closes below the moving average for a sell signal eliminated 1/3 of the trades: From 1960-2018 there were 119 round-trip trades (approximately two per year on average).
Most trades are losing trades with either version of the 200-day moving average system
Using the basic system, 72% of trades were unprofitable. So why did the system work at all? Because the average losing trade was just 1.1% while the average winning trading was 11.6%.
With the improved system, accuracy improved but even so, 62% of the trades were losers and only 38% were profitable. As with the basic system, however, the size of the gains was far larger than the size of the losses: 1.6% average loss for losing trades compared to 12.7% average gain for winning trades.
A review of the chart on page 2 shows why winning trades are so much larger. During strong uptrends a trade can last more than a year, as occurred in 2013-2014 or 2016-2018. In theory there is no limit to the potential profit. On the other hand, the inherent nature of the system limits the size of potential losses to approximately the percentage by which the index is above its moving average.
The frequent losing trades occur when the index crosses its moving average but does not follow through and instead reverses quickly. These sorts of trades are easy to overlook visually but have a major negative impact on the performance of either system.
Examples of frequent small losses occurred in mid-2010 and late-2015 where there were multiple crosses between the index and its average over just a few months.
Trading the 200-day moving average has not worked well recently
The table below breaks down the performance of the system by decade. As with many applications of technical analysis to trading the S&P 500 Index, the 200-day moving average has been less effective in recent years than it was decades ago.
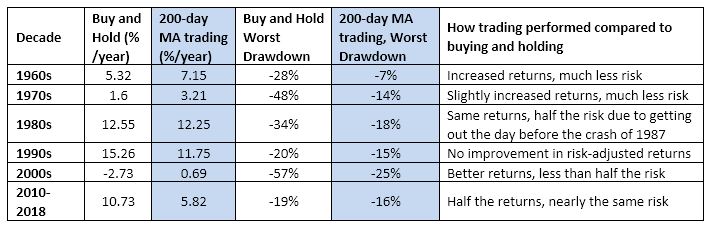
The 1960s was the golden age for this system. Unfortunately, individual investors did not have access to tradeable S&P 500 Index-tracking vehicles back then.
The 1970s was not a time to make money in stocks, but the system succeeded admirably in reducing risk.
The 1980s: During the strong bull market of the 1980s the system did not increase returns but at least managed to mitigate the losses during the crash of October 1987.
The 1990s: It was extremely difficult for any timing model to beat buying and holding during the 1990s, and this system was too slow to significantly reduce risk during either of the bear markets that decade (1990, 1998).
The 2000s: The occurrence of two major bear markets between 2000 and 2009 allowed this system to outperform buying and holding with significantly reduced risk.
Since 2010 the 200-day moving average has been less than useless as a trading tool, missing out on almost half the returns without significantly helping to reduce risk.
Implications
It seems to me that in the absence of another major bear market of more than 30%, which history suggests is unlikely to occur in the absence of a recession, you should not use crossing of the 200-day moving average as a stand-alone timing model.
Since there are no signs pointing to an imminent recession, and since our own timing model remains overall positive (based on price trends, market breadth and seasonality), there is no reason to expect the onset of the sort of significant bear market that would validate selling when the S&P 500 (SPX) moves below its 200-day moving average.
Subscribe to investment newsletter Systems and Forecasts here…


