
In recent posts I’ve described how key bars, known as balance bars tend to create support and resistance lines that can influence patterns many bars into the future. How do we make this technique even more powerful, asks Jeff Greenblatt Wednesday.
Do it on a key chart the market is very interested in.
Take for instance, the bond market. At different points in time, the crowd has blamed selling sequences on higher interest rates. This condition is likely to happen a lot in the future given the bond market recently confirmed a new bear market for prices which means rising interest rates.
But how can you tell when the emotional reaction is likely to materialize?
Let’s look at some recent history. The 30-year Treasury bond was 244 days low to low against the 2017 bottom. This leg down is 14.75.
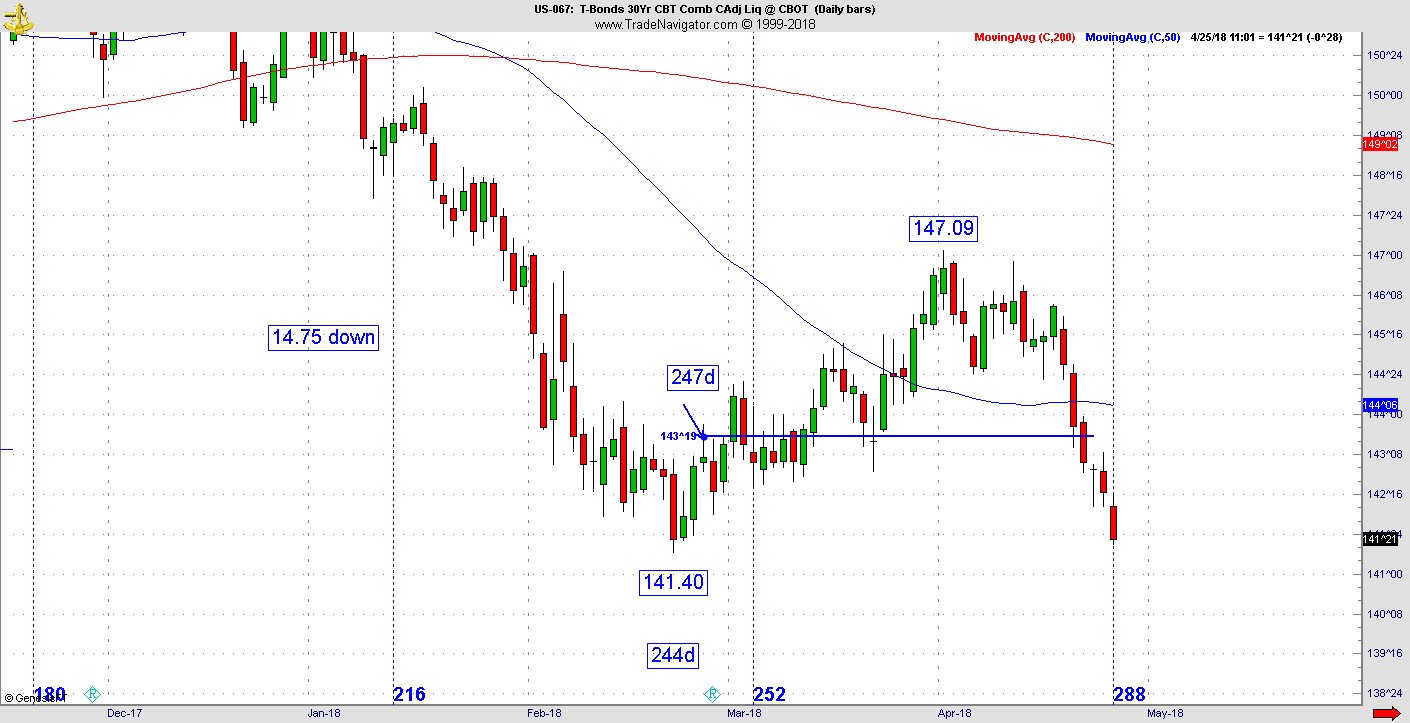
Regular readers to this space know we look to square outs and number vibrations. In this case, given we were at 244 and 14.75, a little outside the box thinking suggested 47 could be important.
Right after the low, the most important bar was on day 247 given the vibration of the drop. From there we draw a line across the screen representing that key inflection. Following the action, we saw the several bars straddle the line and then retested it before it took off. During that period nobody complained interest rates were going up.
Given the vibrations up to this point, is it a surprise the pattern finally peaked as it hit price point 147? Since the high there have been several points in time where higher rates were blamed on the drop in the stock market.
Most notably was last Friday as the action violated the balance line to the downside eliciting the emotional response. In a lot of cases, the balance line being such a key point on the chart will elicit an important emotional response. As prices continue to fall away from the line, the crowd is getting increasingly anxious about higher rates.
How does this work? It is important to establish the key bar which could turn into a condition that will influence many bars into the future. In this case the 247 bar was on February 26 and it still influenced as late as last Friday April 20, almost 2 months later.
Realize not all bars are created equal, some are much more important than others. This sounds simple although its not easy. Apply common sense to see the earliest opportunity to use certain numbers. This is not a black box methodology and it does require some of the same skills one would use to solve crossword puzzles. In this case at 244 days the range is 14.75. That could mean either 75 or 147.
In Gann methodology it’s not the number as much as the vibration of the number that counts. In this case it means 247. Then you saw it top right at 147. When it comes to the market, we can either be forecaster heroes or make money, but chances are we won’t do both. In one sense this is like a trend following methodology. As it starts to trend away from the line, that’s where you want to be whether it’s going up or down.
Since square outs/vibrations drive the bus, these points on the chart are more accurate than moving averages.
Last Thursday night (April 19) there were any number of vibrational square outs in the stock market suggesting it could drop immediately. It’s important to test that hypothesis by looking at supporting evidence.
On Thursday night the bond market was sitting right on the line. Since this was not absolute support there should be no problem thinking it could violate. A violation of the line increased the probability of a complete thrust lower which meant it could hurt the psychology and price action of the stock market.


