
Going forward risk remains high for short-term traders and the resolution likely comes only when one red line or the other on the chart is violated in a meaningful way. Until that happens, lock in profits and don’t get whipsawed, writes Jeff Greenblatt Wednesday.
The stock market changes direction every few days and has settled into a tight range. It’s time to look at how we got here and what to expect going forward.
Recently, Amazon (AMZN) hit a new high based on the earnings report from last week. On the other hand, we have stocks like Lockheed Martin (LMT) representing defense contractors which are hitting new lows. This truly is a market that has something for everyone.
Overall, it’s a tight market and after careful consideration here is my hypothesis.
As you know the Dow Jones Industrials (DJI) peaked in January at 26616 and through February and March, the square out at 116-time units created a balance line until it broke down at the seasonal change point. The real last leg to the low started on March 21 which timed with the big Fed meeting.
Since then a new balance line has formed. When you look at the daily chart of the Dow it reveals a pattern that is down 44 days with a low of 23344. If you really wanted to rip this low number apart, the 233 aspect is derived from Fibonacci number 233 while the 44 comes from Fibonacci 144.
There are no such things as coincidence when it comes to financial markets. In any event, the secondary low since the bottom hit at 143-44 180 min bars. What has been accomplished is another balance line associated with the low. The action since April 6, nearly a month, has taken place in this tight range above the 44-line associated with the bottom and the 116-line associated with the top.
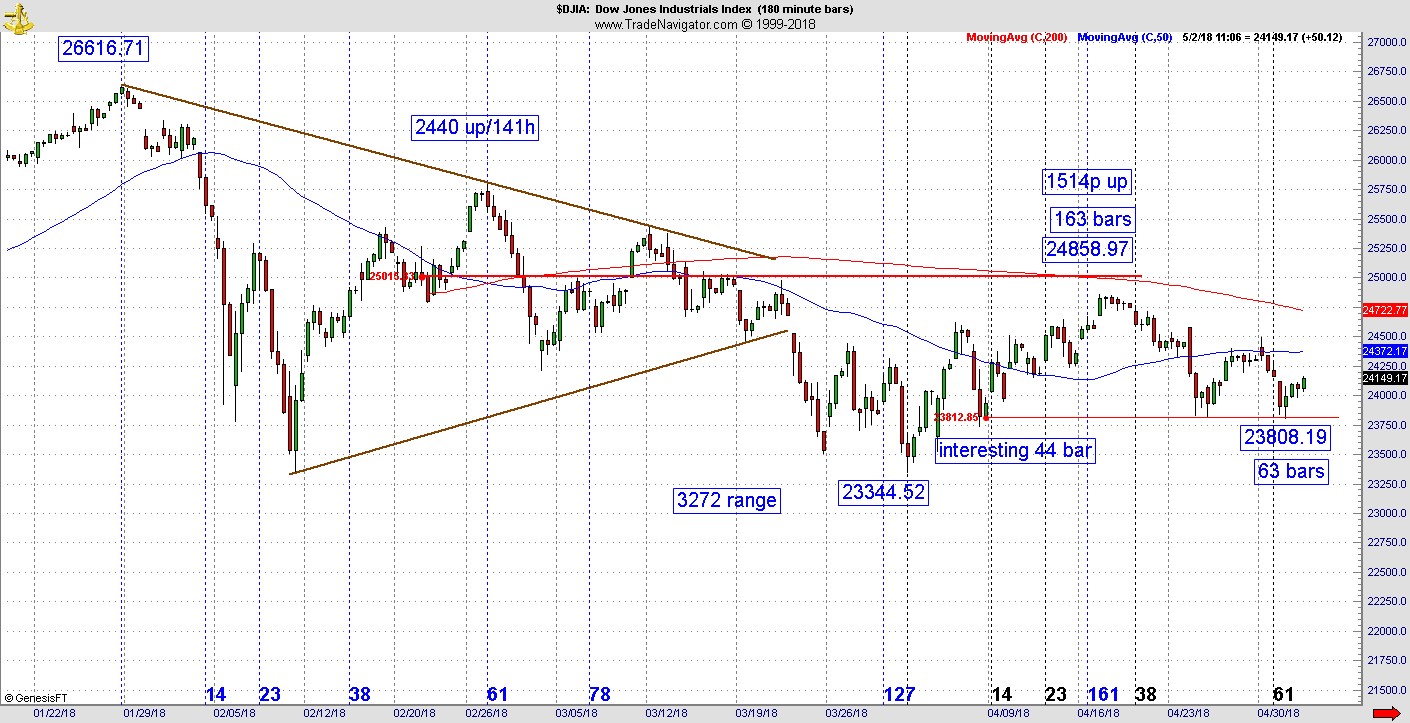
These are the two red lines you see on the chart. What is most interesting right now is the recent support from April 25 and May 1 is the Dow has not been able to penetrate south of the 44 line. What might be even more interesting is the recent high on April 17 is 163-180 min bars off the top while this recent test of the 44 line is 63-180 min bars off the bottom.
What also might be confusing traders is the geopolitical situation.
Last week the world witnessed the potential legal end to the Korean conflict which ended with a cease-fire in 1953. They’ve never signed a treaty. One could make a case peace breaking out on the peninsula is the psychology behind defense stocks taking the hit.
But on the other side of the coin, Haaretz and the New York Times reported Israeli F-15s bombed a Syrian base Sunday that contained Iranian anti-aircraft missiles. The Israeli prime minister went on international television making his case for the West to get out of the Iranian nuclear deal.
The deadline originally set by the Trump administration is May 12.
Are the markets waiting for a resolution to this conflict? The risk now is the conflict could escalate but it can also bring the Iranians to the table to negotiate a new deal. In addition to geopolitical risk, if the nuclear deal goes away, the Iranians go back on sanction which could impact oil supply.
Oil prices could spike more than they already have which would effectively nullify the benefits of the Trump tax cuts. To this point 2018 has been the year of the market looking for an excuse to sell.
Recall last year I referenced Lord Rothschild who stated he believed we were in the equivalent of a 1937 market. That being the case, we are no longer in 1937 and one step closer to a wider conflict.
The 1938-39 market was mostly in a tight range until the war broke out.
Right now, this is a market where short-term traders on the bull and bear side have been able to thrive. Going forward risk remains high and the resolution likely comes only when one red line or the other on the chart is violated in a meaningful way.
Until that happens, lock in profits and don’t get whipsawed.


