
Global equity markets continued to advance. Last week’s newsletter noted the importance of closing the week above the all-important 2750 level in the Emini S&P 500 September contract, writes Nell Sloane in her wide-ranging Trading Notebook Tuesday.
We knew this level was huge considering the close below on June 29 sent the contract below our 7-week moving average and was on the cusp of losing further ground.
But all tariff worries aside, all geopolitical NATO posturing aside, the equity markets continued their advance on the tailwinds of massive continued corporate buybacks.
Before we get into the markets, let's dig into a few notable names from last week.
Wells Fargo (WFC) saw Q2 profits sink 11% on weakness in their main business units as well as ongoing costs related to their terrible mismanagement of corporate integrity. Their shares fell 1.2% to $55.36 on Friday.
On the flipside PNC Financial Services Group (PNC) saw profits jump 24% to $1.35 billion. Shares rose 33 cents to $138.42.
JPMorgan (JPM) and Citigroup (C) also posted double digit profits as borrowing rose. So, it seems the flat yield curve hasn’t shown up in the earnings, yet.
**
American Airlines Group (AAL) lowered its Q2 revenue outlook, noting rising fuel charges. AAL lost 8% on the news from Wednesday last week and closed Friday at $37.12 up 79 cents.
**
Computer Associates (CA) spiked 19% last week as it agreed to a buyout from Broadcom Inc. Broadcom (AVGO) is offering $44.50 per share. The deal is valued at $18.9 billion.
**
Papa Johns (PZZA) popped 11% last week as founder John Schnatter resigned as chairman, can you say insert pizza foot into mouth please, we can’t imagine the PR nightmare, for some reason Paula Deen comes to mind…
**
We also read a good note from John Mauldin last week. One thing he pointed out was this: “A new report by the American Legislative Exchange Council (ALEC) shows the unfunded liabilities of state and local pension plans jumped $433 billion in the last year to more than $6 trillion.”
We point this out because if the SP500 return was 22% last year and the NASDAQ was 27% yet the unfunded liabilities grew some 38%. What will happen when the market has a down year? These are truly scary figures, as we have said time and time again, update after update, that the mathematics will eventually destroy all of these illusions.
Using debt to supplant savings for organic growth is governed by the exponential laws of diminishing returns, or in simpler terms as time moves to the right, it will take more and more debt to produce an equalized amount of growth. The longer that persists, the larger the problem gets and it never truly goes away, but it dies in spectacular fashion, unfortunately!
As long as the pension funds and central banks are willing buyers, either directly or indirectly through stealth operations, then the day of reckoning keeps getting pushed out.
**
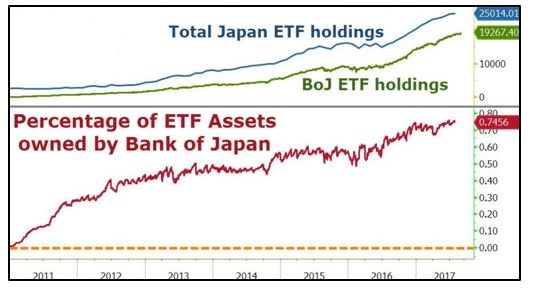
Speaking of central bank and pension fund buying, and the correlation as to why markets never fall, we present this chart from Zhedge:
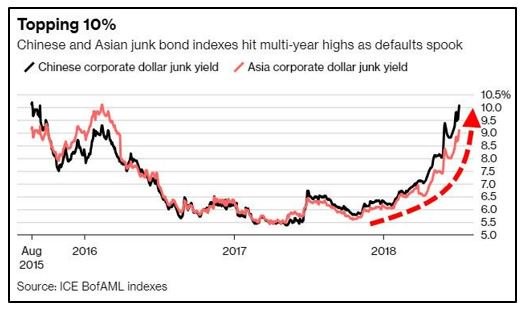
Staying in Asia, the next chart is troubling, we touched on Chinese shadow banking last week, and we have seen noticeable contractions in the data there. Considering this tightened environment, it is no surprise that junk bond indexes in China and Asia are climbing.
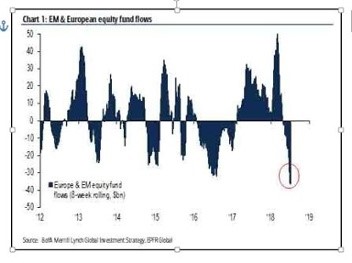
We also saw an interesting chart from our Zhedge friends, this time displaying the Europe and EM equity fund flows, which have plummeted to multi-year lows.
The contrarian in us can’t help but think a hefty global pension and SWF roll-tack maneuver may be upon us. For those who aren’t into sailing, it is in reference to sailors moving in unison to one side of the boat while turning through the wind, using the weight of the crew to assist.
In the market’s case, it’s getting everyone on the same side and then take the trade square in their face.
Anyway, and considering the huge underperformance of the DAX this year compared to its U.S. counterparts, the intuition in us senses a change may be upon us as everyone’s on one side of this boat.
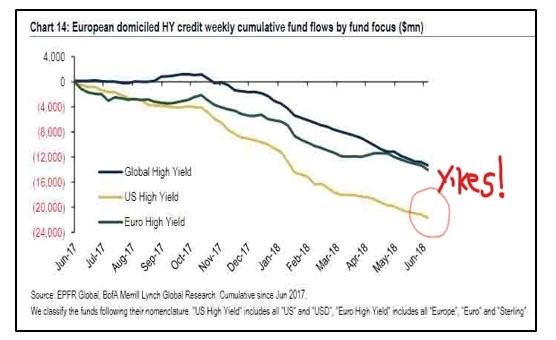
As far as looking at an overall European picture of funds in regards to the high yield market, this chart clearly shows the breakdown since late 2017:
**
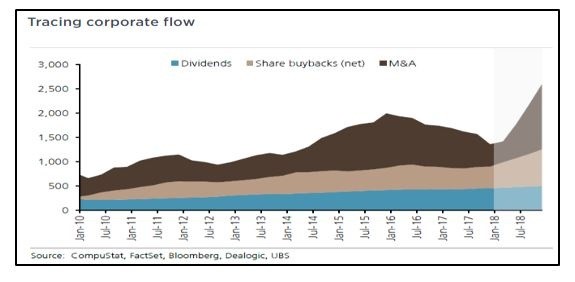
OK, just to be fair there is a flipside to all of this selling, right, zero sum games after all.
OK, so in order to save the day, the buying can simply be summed by taking all the buybacks, all the dividends and even further all the share smashing-M&A activity.
So, I guess it’s a function of simple supply demand, remove shares, price increases nominally:
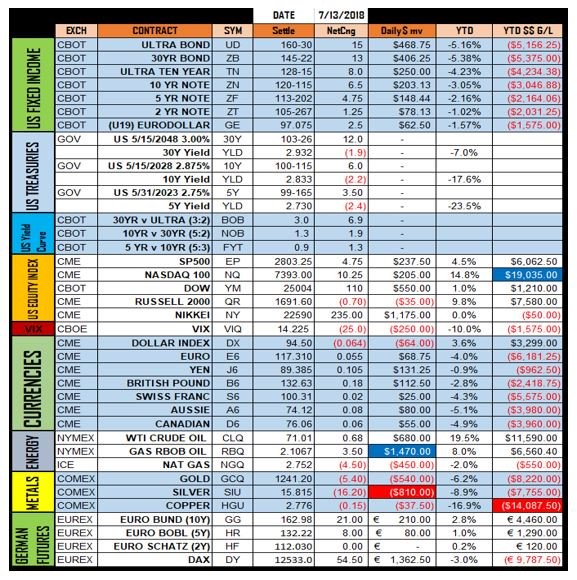
Ok let’s take a look at last Friday’s settlements prices:
We will continue to monitor this asset allocation of EM vs. DM and more precisely the Nikkei and DAX vs. their U.S. counterparts.
I find it very curious that the U.S. fixed income has held up so well with equities rising. In particular both the U.S. government 30-year and 10-year auctions went well.
The yield curve continues to flatten and option gamma seems to be picking up in the short rates, so something might give here, we’ll see.
Cheers!
Nell
Subscribe to Nell Sloane's free Unique Insights and CryptoCorner newsletters here


