The consumer is the most important part of the American economy. If the consumer is strong, the economy is strong. Despite some middling housing data, the consumer is still in great shape as leverage is low and spending growth is high, writes Don Kaufman Saturday.
There are worries about real wage growth being negative this summer, but once the year over year comparisons for inflation get tougher, inflation will come down. Plus, the commodity index has been weak recently; this will cause inflation to fall further.
Shelter inflation is the biggest reason overall inflation is so high. The weakness in the housing market has shifted it to become more of a buyers’ market than a sellers’ market.
One encouraging stat is 14% of listings in June saw a price cut which is more than the trough of 11.7% in late 2016. There doesn’t need to be huge softness for inflation to fall. It just needs to be modest along with rates not rising much. That second part could be challenge as rates have been rising along with growth. One other part of inflation is the tariffs.
If trade deals are struck, prices could come down in the areas tariffs have already been enacted in. If the trade skirmish becomes a trade war, inflation will increase in more industries.
Retail sales growth was strong in July and Walmart (WMT) had the best same store sales growth in over 10 years. This shows how great the economy is and opens up the possibility that Q3 growth will come close to matching Q2, especially if Q2 is revised slightly lower.
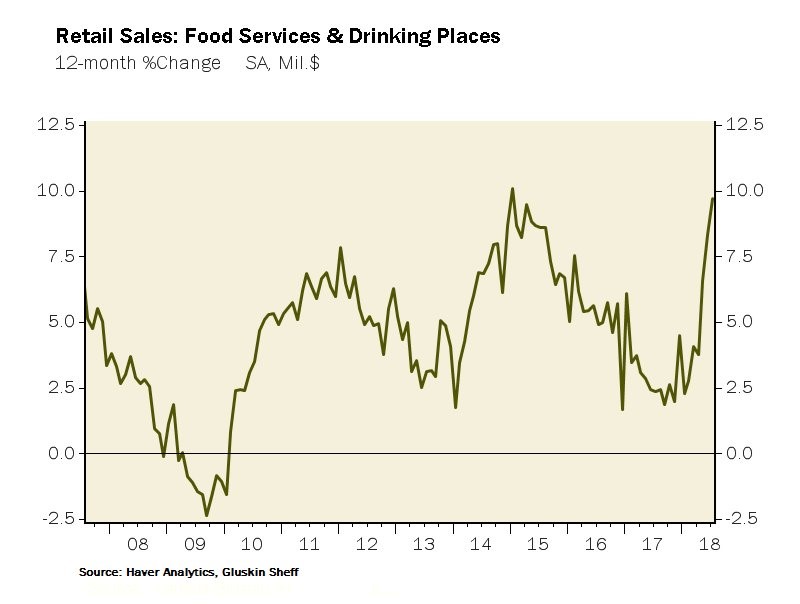
The three-month average of year over year retail sales growth is 6.3% which is a 76-month high as it is the best growth since March 2012. As you can see from the chart below, it’s not just Walmart that is doing well. The 12-month change in seasonally adjusted retail sales in food services and drinking places is slightly below 10% as it is almost at the quickest growth rate in this expansion.

Just as this expansion is nearing the longest ever, it is putting up great numbers, slapping down the idea that it is close to over. It is strong because there have been a couple slowdowns in this expansion which have extended it. To be clear, we haven’t eliminated recessions.
Don’t believe that just because this is about to be the longest period without a recession in the modern era. That’s just like how bears falsely believe we are in a new bubble economy which causes major crashes in stocks at the end of business cycles just because there were two sharp crashes at the end of the last two cycles.
Industrial production misses estimates
July industrial production was up 0.1% month over month which missed the consensus for 0.3% growth. The good news is the June reading was revised higher from 0.6% growth to 1% growth. Manufacturing growth was 0.3% month over month which met estimates but was below last month’s 0.8% growth.
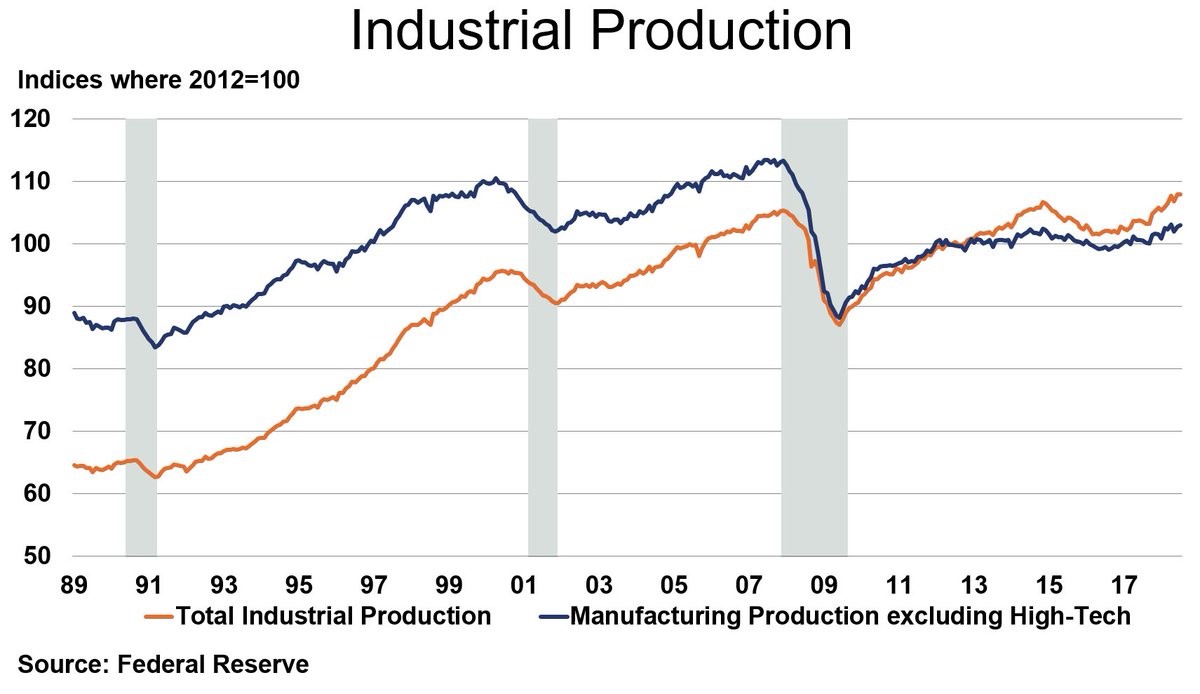
As you can see from the chart below, total industrial production is at a record high. Compared to previous cycles, this growth has been very mediocre. It recently surpassed the peak in 2015 which was only slightly higher than the peak in 2007.
Manufacturing production excluding high tech is even worse as it barely expanded in the previous cycle and is still below the 2007 peak.
Production is at the cycle peak, but that doesn’t mean much. It’s interesting to see such low manufacturing production when the regional Fed indexes are all near or making record highs and there has been a sudden resurgence in manufacturing hiring.
The regional Fed reports are surveys with small sample sizes and even though manufacturing hiring is accelerating, it is way below the job total at the peak in the late 1970s and below the total in the last cycle.

Headline industrial production growth was brought down by a rare 0.3% decline in mining volumes. Mining was up 12.9% year over year. Energy is no longer a boon to the month over month numbers as prices have peaked for now.
Utilities also brought down production as they fell 0.5% which is the third straight contraction. You can say this report isn’t as bad as it looks just like it was as good as it looked a few months ago when utilities and mining were strong.
Utility production is reliant on the weather, so it doesn’t accurately reflect the underlying strength in the economy. The weak growth in July was also affected by the positive revision in June which made the month over month comparison tougher. June was revised higher mostly because mining growth was changed from showing 1.2% growth to 2.9% growth and utilities changed from a 1.5% decline to a 0.7% decline.
Manufacturing was helped by vehicle production which was up 0.9%. High tech was only up 0.1%. Production of business equipment was up 0.8% and production of consumer goods was flat. Construction supplies were down 0.1% which won’t help shortages in these goods.
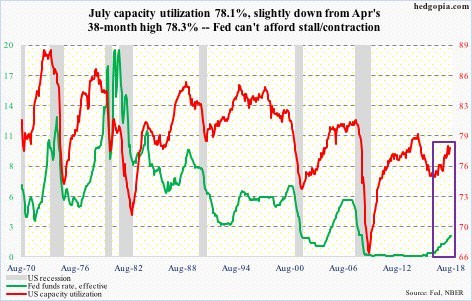
As you can see from the chart below, capacity to utilization was unchanged at 78.1%. It was 0.1% below the consensus and June’s number was revised 0.1% higher.

The capacity to utilization is 0.2% below April’s 38 month high, but that number wasn’t high by historical standards. It’s not even the cycle high. There is still room to increase to the levels seen at the peak in the last expansion despite the fact that the regional Fed reports signal there is no excess capacity and deliveries are being delayed by supply constraints.
The chart states the Fed can’t afford to stall rate hikes or cut rates if it wants to maintain its tightening bias. The fact that capacity to utilization is increasing means it makes sense to hike rates, but this obviously isn’t the only stat the Fed looks at. Inflation could be mitigated by the decline in commodities brought about by the strong dollar and slowing global growth.
Because I think there is still excess capacity, inflation shouldn’t accelerate until the capacity to utilization rate increases close to the previous cycle peak.
Subscribe to TheoTrade here...
View a brief video interview with Don Kaufman on volatility for traders and investors here
Recorded at TradersExpo New York Feb. 25, 2018
Duration: 2:34.


