
I’d like to discuss something near and dear to my heart that I don’t often share publicly: inversion. There’s much narrative spun on the likely inversion of the U.S. yield curve (10-year yields minus 2-year yield) and what that inversion portends for the U.S. economy.
Media pundits, gurus and fearmongers like to trot out data sets and say “Every time X has happened with this data set, a recession occurs. Furthermore, X is happening now, so …”
Frankly, not only is this type of “analysis” lazy, it’s got more faults than San Andreas.
Presumably, every time the yield curve inverts, we experience a recession, and apparently an inversion is soon coming to a Treasury market near you.
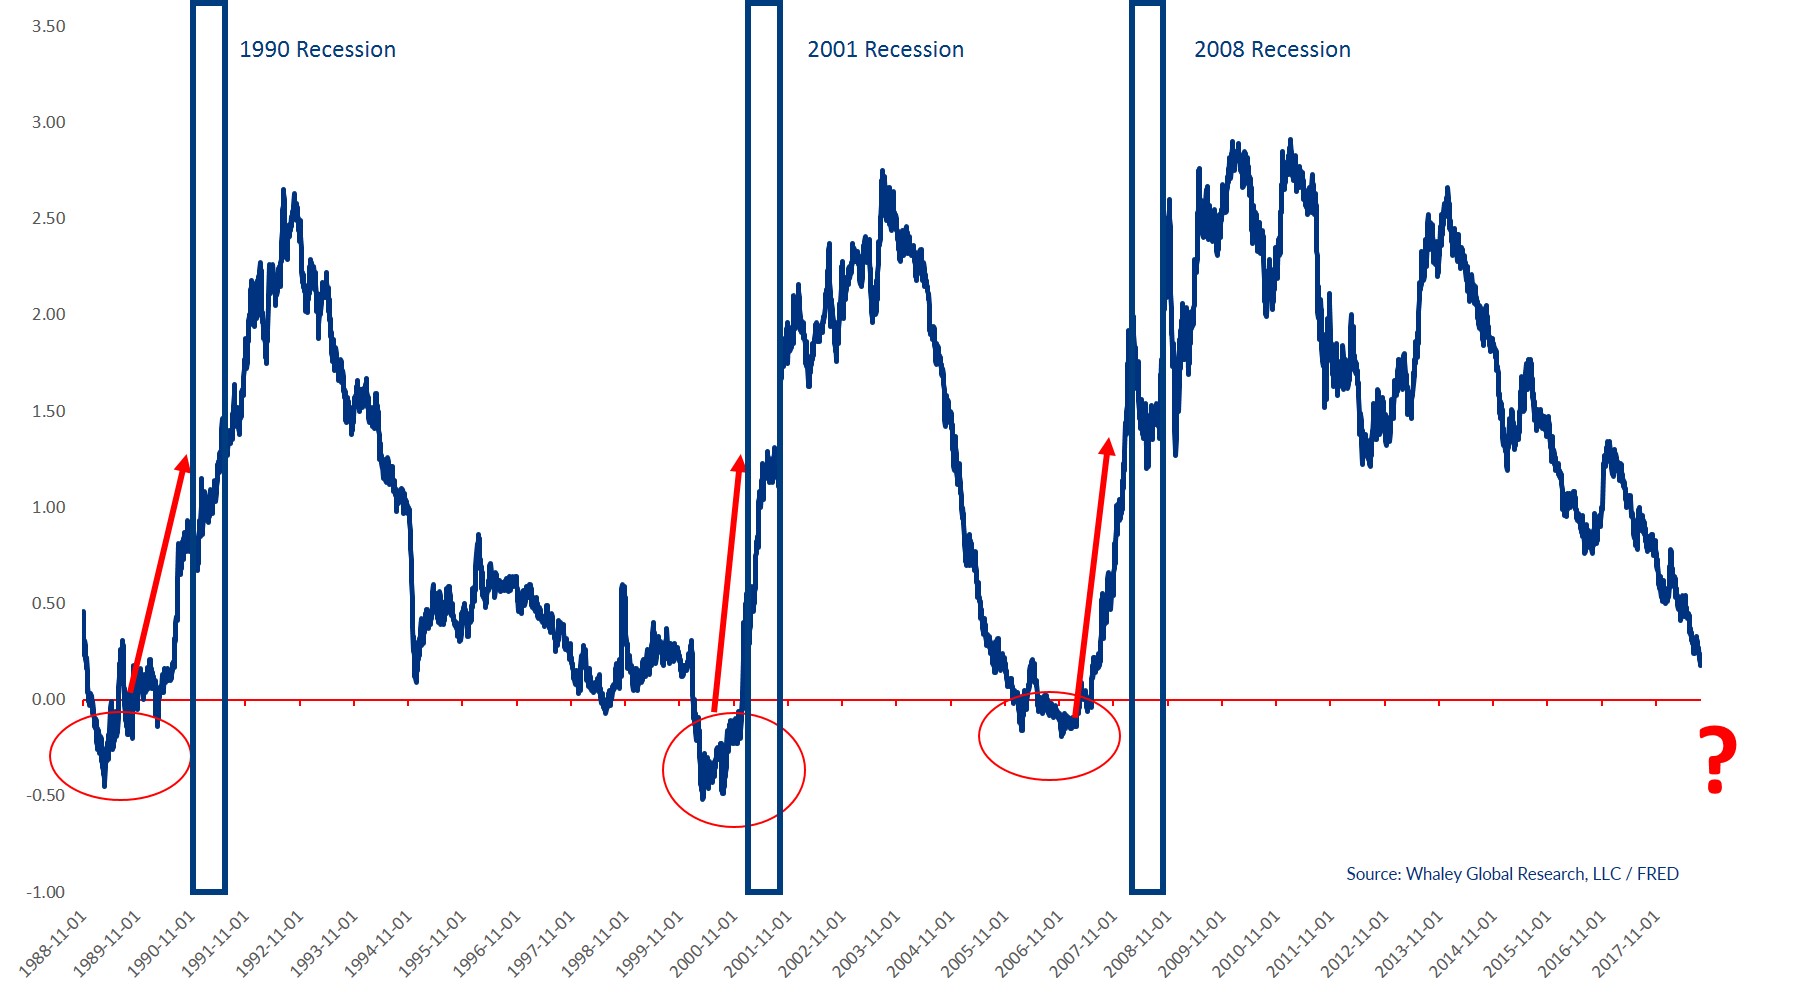
What Captain Inversion doesn’t understand is that it’s not inversion of the yield curve that one should pay attention to. Instead, it’s the hockey stick in the YC that occurs after the inversion that matters most.
More to the point, don’t let Captain Inversion scare you into believing that if the U.S. yield curve does invert, then it’s time to build a bunker loaded with canned food and ammo.
In fact, since July I’ve been hot and heavy for an asset class that benefits from an inverted yield curve, and that’s U.S. Treasuries. Behaviorally, the only markets in the world more hated right now are copper, gold and coffee. Yet despite being an asset class of ill repute, U.S. Treasuries are the perfect market to be long should the yield curve invert.
Since 1988, the yield curve has inverted for a meaningful duration on three separate occasions:
- The first inversion lasted six months from December 1988 to June 1989, and long-dated U.S. Treasuries gained +9.6%.
- The second inversion lasted 10 months from February 2000 to December 2000, and long-dated Treasuries gained +12.1%
- The third inversion lasted 10 months from June 2006 to March 2007, and long-dated Treasuries gained +8.9%.
Not only are the returns more than palatable, the average peak-to-trough drawdown experienced during these inversions was just -4.1%. With an average gain of +10.1%, the reward-to-risk is more than 2-to-1 in favor of the upside.
The Fundamental Gravity in the U.S. is becoming more and more bullish for Treasuries with each passing month, and an inverted yield curve would add accelerant to that bullish bonfire. Couple these realities with an uberly bearish Behavioral Gravity Index and you have all the makings for a terrific trade.
Inversions do tend to occur before recessions, but the average interval between the end of the yield curve inversion and the beginning of the economic recession is eight months.
We will have plenty of far more meaningful (and timely) economic and financial market road signs than an inverted yield curve to help us risk manage the next U.S. recession.
Please email us at ClientServices@WhaleyGlobalResearch.com if you’d like to participate in a an eight-week free trial of our research offering, which consists of three weekly reports: Gravitational Edge, The 358, and The Weekender.


