
State of the market: The current decline should be more than halfway over. U.S. stock indexes are retesting their Oct. 11 lows, with bulls and bears battling just below the 200-day moving average of the S&P 500, writes Marvin Appel Thursday.
As in March, the S&P 500 SPDR (SPY) tumbled 20 points (7%-8%) until finding support near the 200-day moving average. It remains to be seen whether the recent correction will end near current levels or whether SPY will make another leg down. If the decline does extend, the next support areas lie around 263.5 and 257, the latter being the Feb. 8 closing low. (See chart below.)
Our U.S. equity timing model has remained on a Buy signal throughout the recent turbulence, reflecting continued positive long-term price trends, favorable seasonality and restrained increases in option implied volatility.
The worst historical drawdowns during Buy signals were 10%-11%. That would imply a downside objective of 261 in a bad-case scenario, which would represent an 11% drawdown from the Sept. 20 peak. The implication is that if historical precedent holds up, the current market correction should be in its sixth inning at worst.
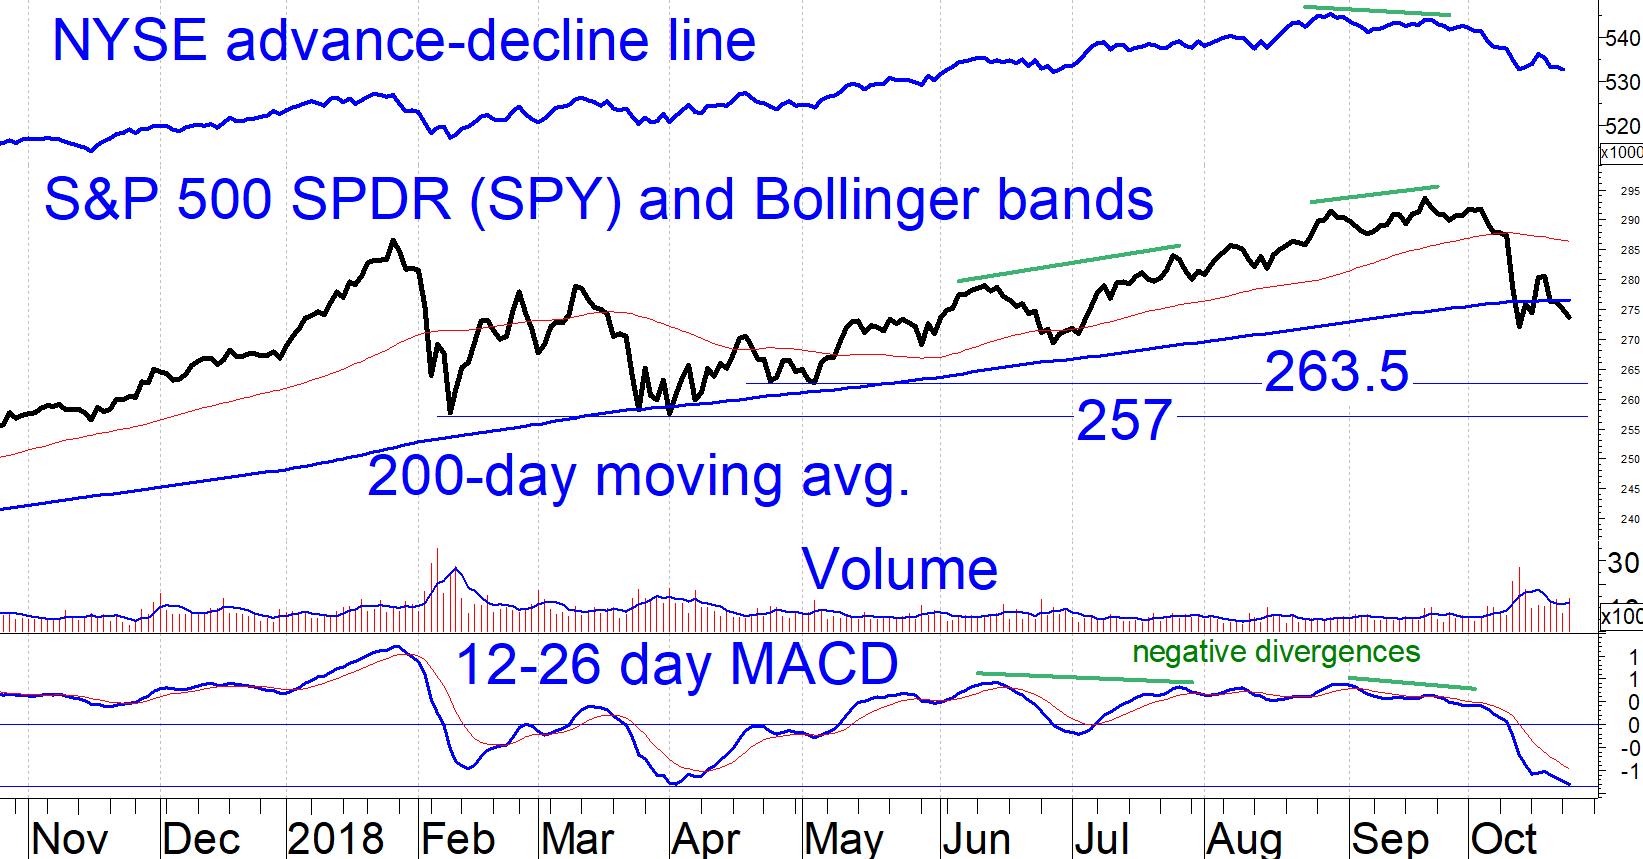
There are glimmers of hope in the SPY chart.
First, the 12-26 day MACD is at its most oversold level of the year, suggesting the possibility that the decline has gotten overdone in the near term.
Second, on Oct. 23 the S&P 500 (SPX) opened with big losses of over 2% but recovered to close down ½%. Volume was heavier than normal on this day, which I view as near-term bullish.
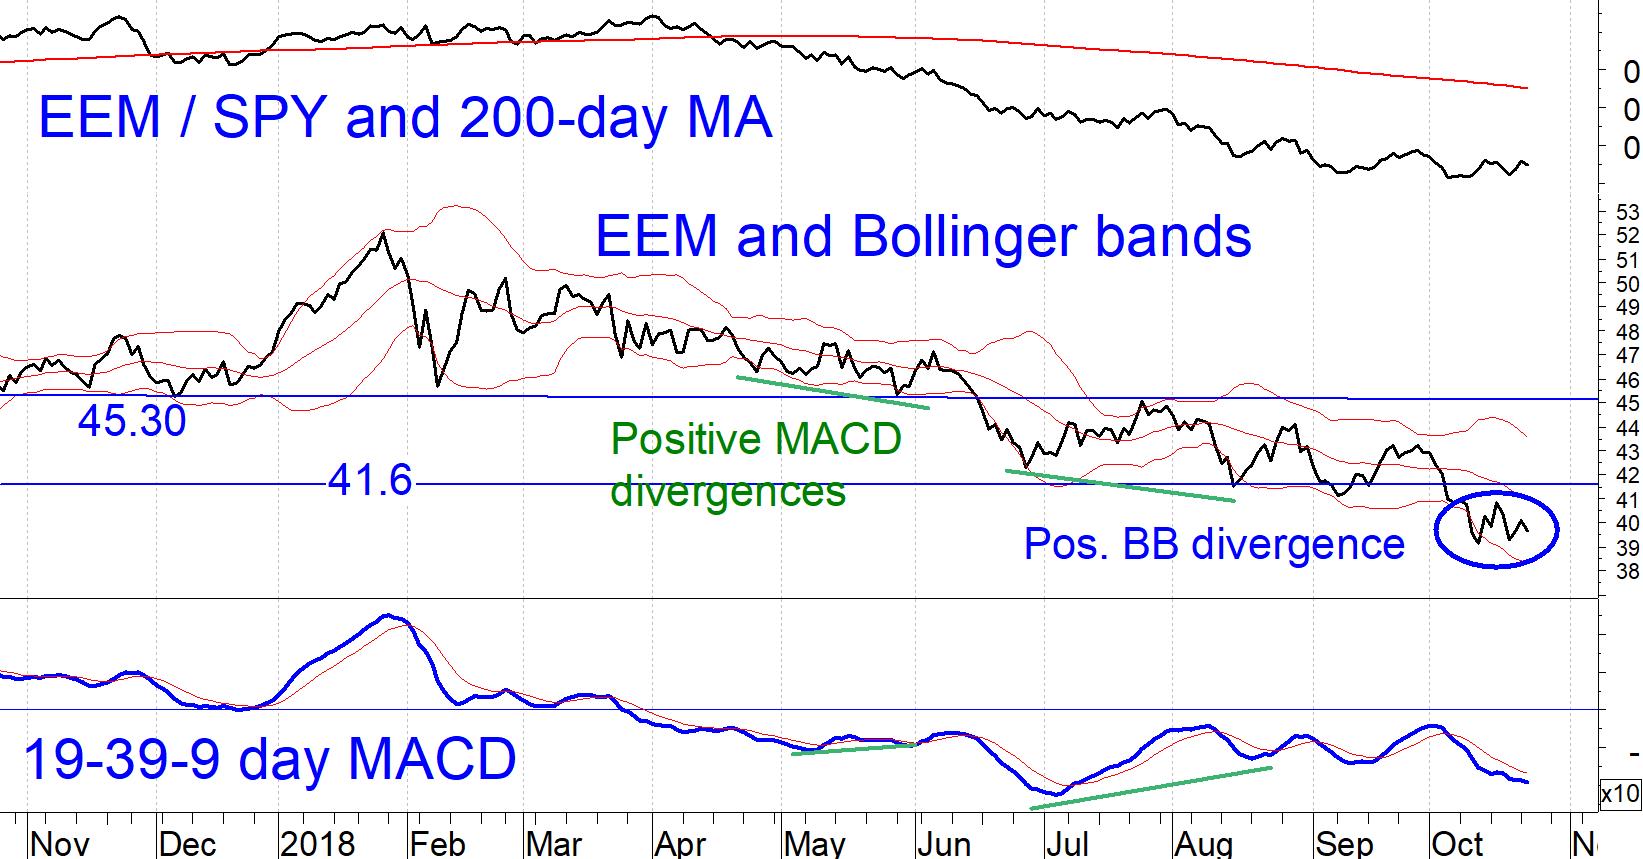
One other potentially hopeful sign is that emerging market stocks seem to have found their footing. The chart below shows a positive Bollinger band divergence (circled in blue). This occurred when the iShares Emerging Market ETF (EEM) closed below its lower Bollinger band on Oct. 11, but retested that low on Oct. 18 within the bands.
Moreover, EEM stopped lagging the S&P 500 in early September and has since kept pace. I view this as positive because much of what troubles the stock market—rising interest rates, possible trade war, possible economic slowdown—should have a greater negative impact on emerging market stocks than on our own.
I believe it will be instructive to watch the high yield bond market.
The iShares High Yield Bond ETF (HYG) is so far clinging to support near 84.90. (It closed at 84.86 on Oct. 23.)
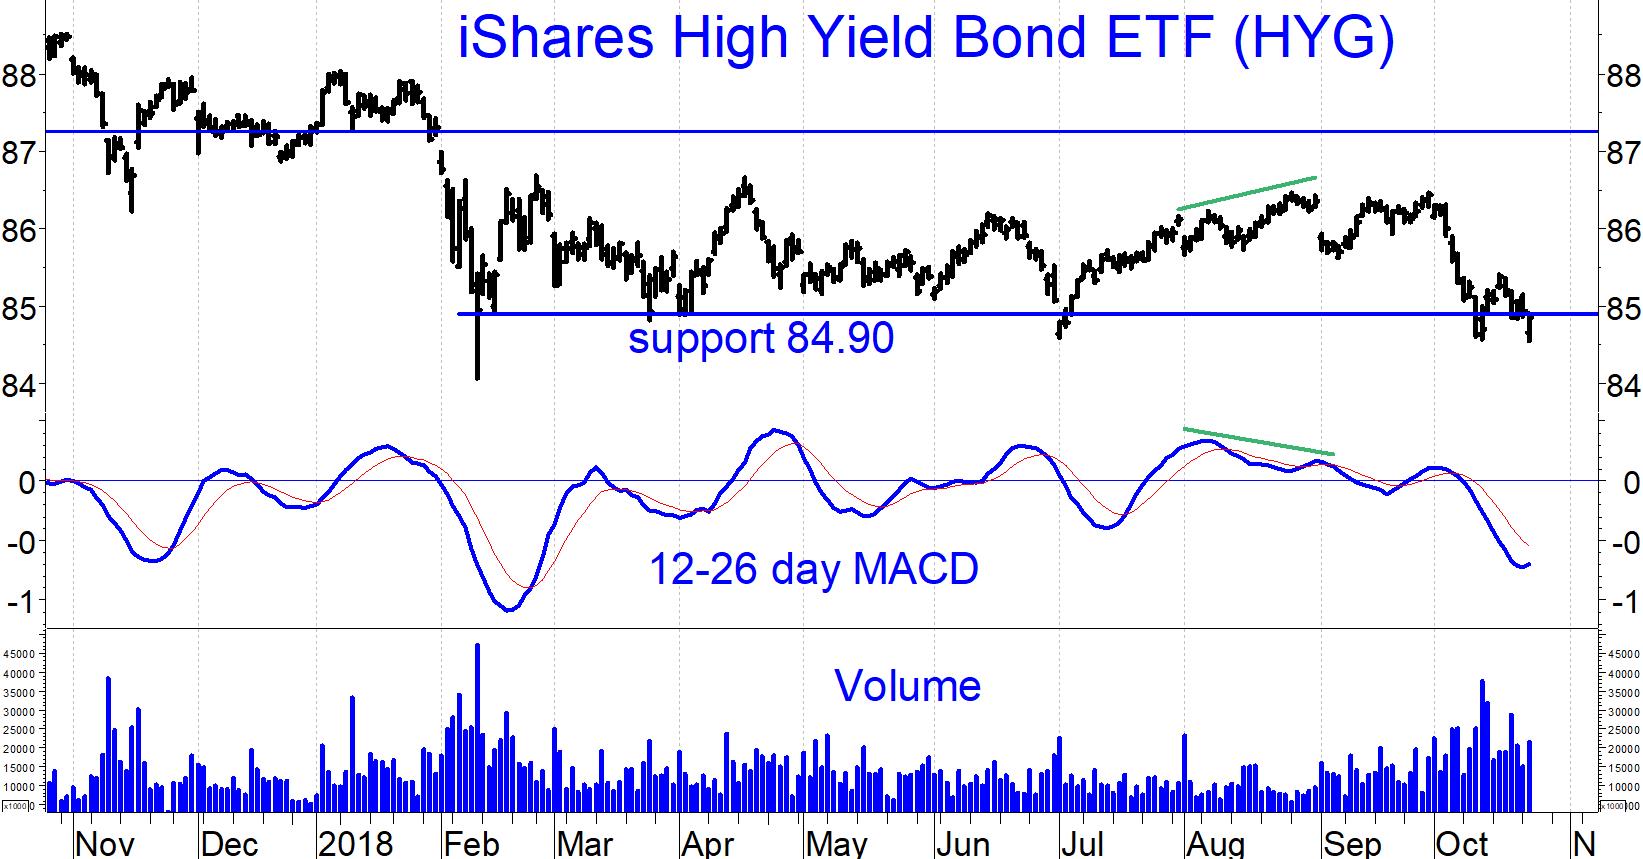
Although one of our internal models generated a high yield bond Sell signal last week, our newsletter high yield bond models remain on Buy signals. As long this is the case, risk in both high yields and in U.S. equities should be contained.
A newsletter high yield sell signal, which I believe has only a 50/50 chance occurring this year, would be bearish for both markets.
—Marvin Appel
Sign up here for a free three-month subscription to Dr. Marvin Appel’s Systems and Forecasts newsletter, published every other week with hotline access to the most current commentary. No further obligation.
View a video interview with Marvin Appel and Dan Gramza on 2018 investing opportunities here.
Recorded: July 25, 2018 at TradersExpo Chicago.
Duration: 6:30.
View a video interview with Marvin Appel and John Bollinger on Bollinger Bands, when they are most useful for traders and about systematic investing pioneered by Dr. Appel and his father Gerald Appel here.
Recorded: July 25, 2018 at TradersExpo Chicago.
Duration: 4:31.


