
This severe correction may have hit its low on December 24, when the S&P 500 Index (SPX) closed at 2351, representing a decline of 20% since October 3. SPX closed Friday at 2532, up 84, writes Dr. Kerry Given Saturday. He's presenting at TradersExpo New York.
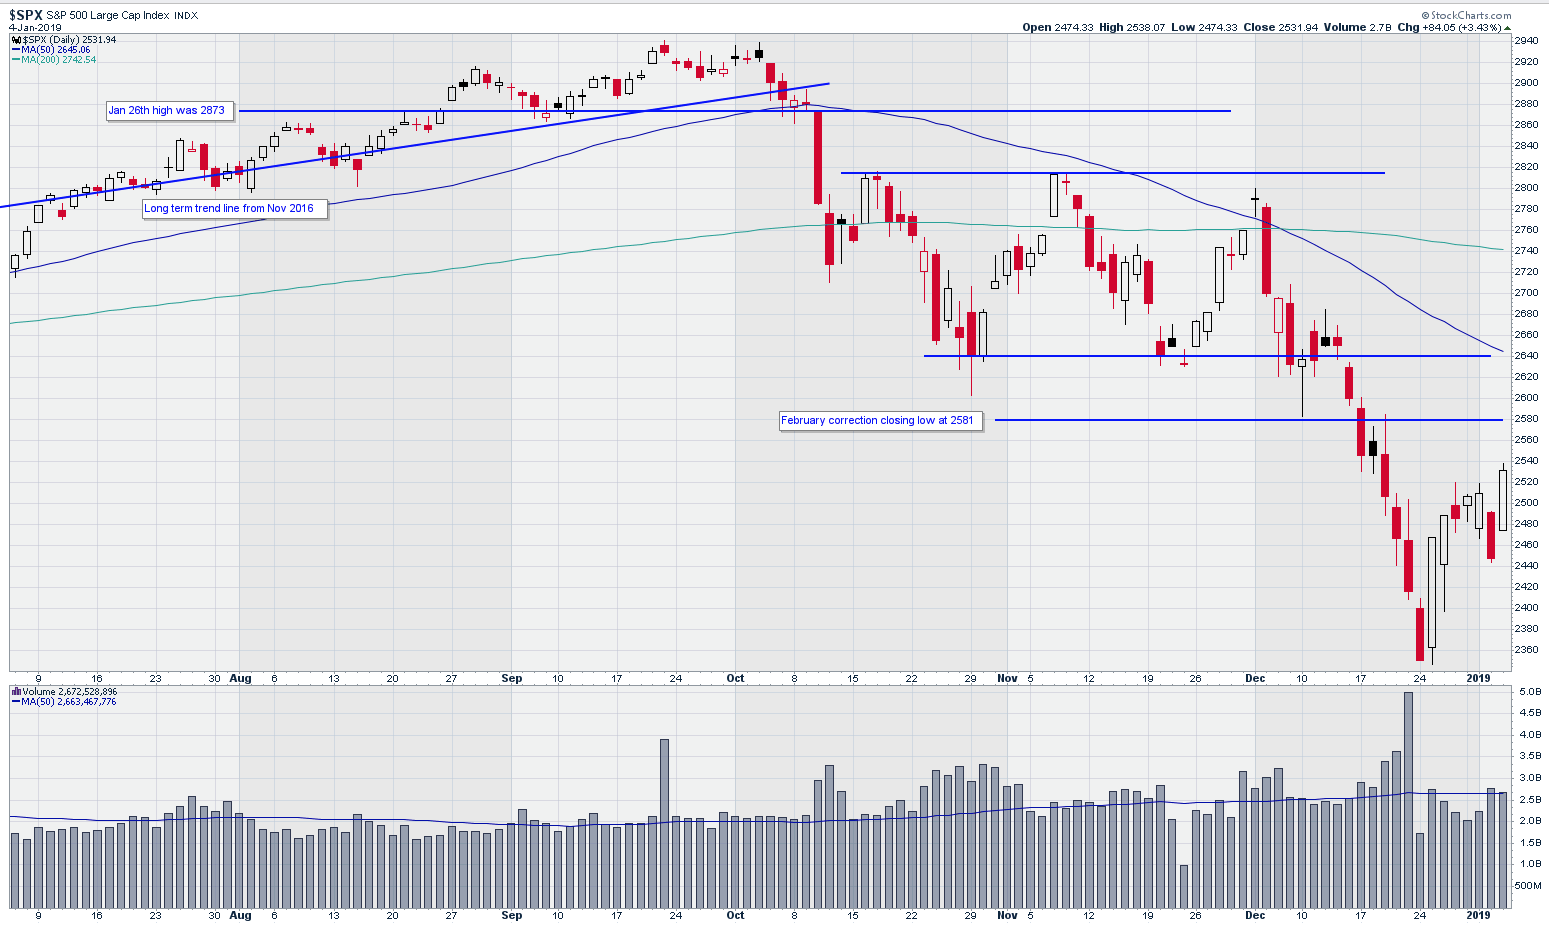
Standard and Poor’s 500 Index (SPX)
Chart courtesy of StockCharts.com
The major market indices rallied strongly the day after Christmas and gave traders hope. Technical analysts often look for what they call a follow through day after a correction low is recorded. This follow through day is considered the signal that traders may once again enter the market with some confidence that the correction is past.
One begins counting days after the strong bullish move following the correction low (December 26). The day count continues as long as the low price of day one isn’t broken. On day four or later, the analyst watches for a strong bullish trading day with volume equal or higher than the previous day. When that is achieved, the follow through day has occurred. Friday was day seven and the market’s strong push higher satisfied the criteria for the follow through day.
Trading volume in the S&P 500 has run below the 50-day moving average (dma) throughout the holidays. Thursday and Friday’s trading volume finally reached back up to the 50 dma.
SPX ran consistently along the lower edge of the Bollinger bands from December 17 through the 23. Trading over the past seven sessions has pushed SPX back to the 20 dma in the center of the Bollinger bands.
Statistically speaking, we might expect SPX to trade in either direction on Monday. It would not be surprising to see some selling take place after the strong performance since December 26.
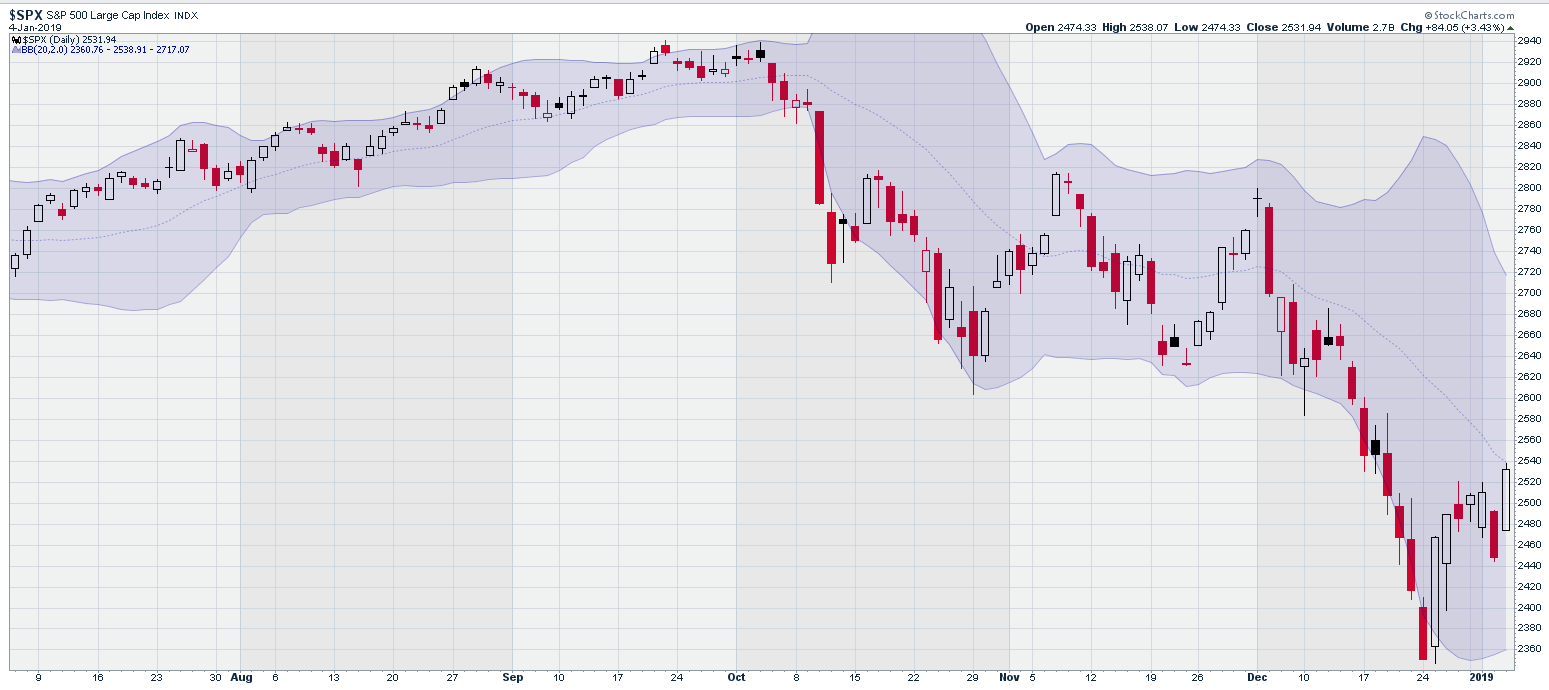
SPX with Bollinger Bands
Chart courtesy of StockCharts.com
Volatility, as measured by the S&P 500 Volatility Index, (VIX), closed Friday at 21.4%. The high point for VIX came on December 24th at 36%. This was almost an exact match of the peak in volatility in the February correction at 37%.
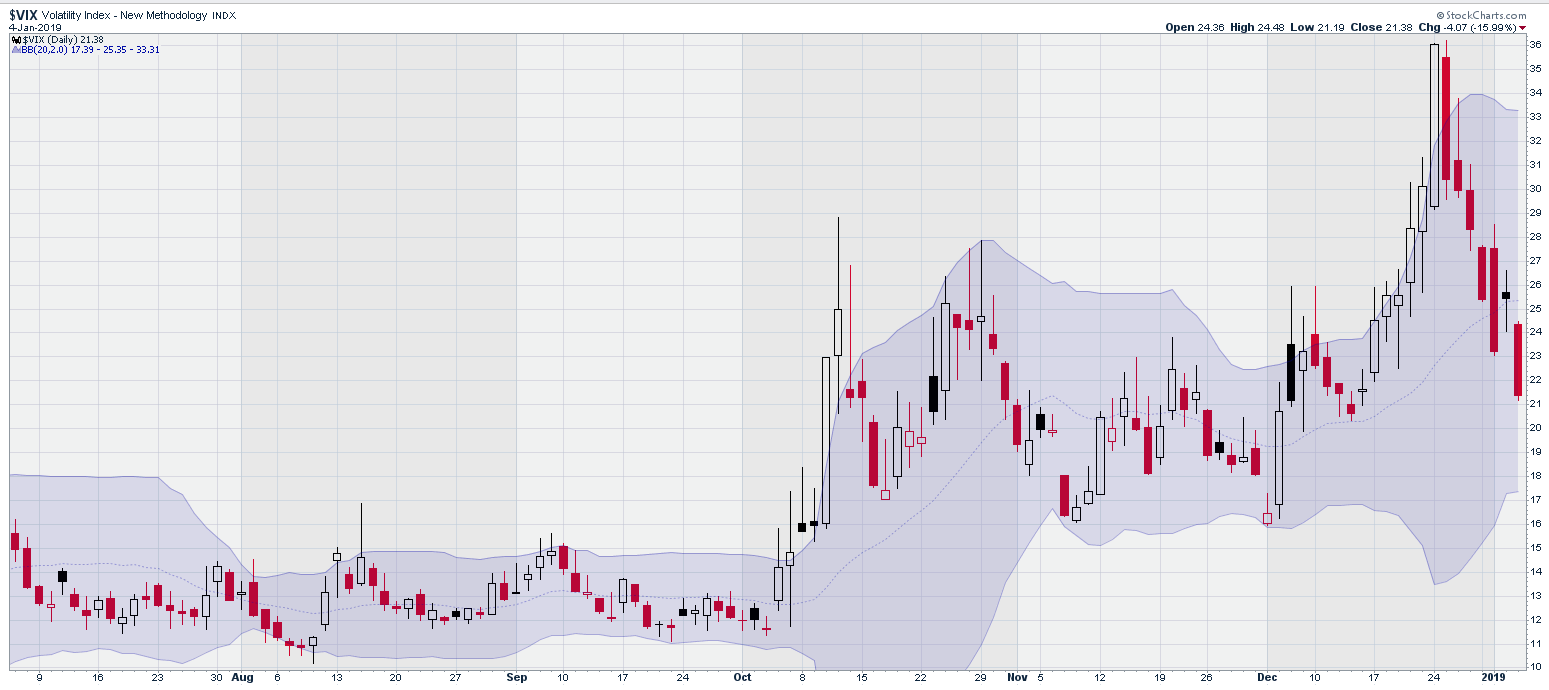
CBOE SPX Volatility Index (VIX)
Chart courtesy of StockCharts.com
The Russell 2000 Index (RUT) closed Friday at 1381, up 50 points. Russell has led this correction, down 25% from early October to December 24.
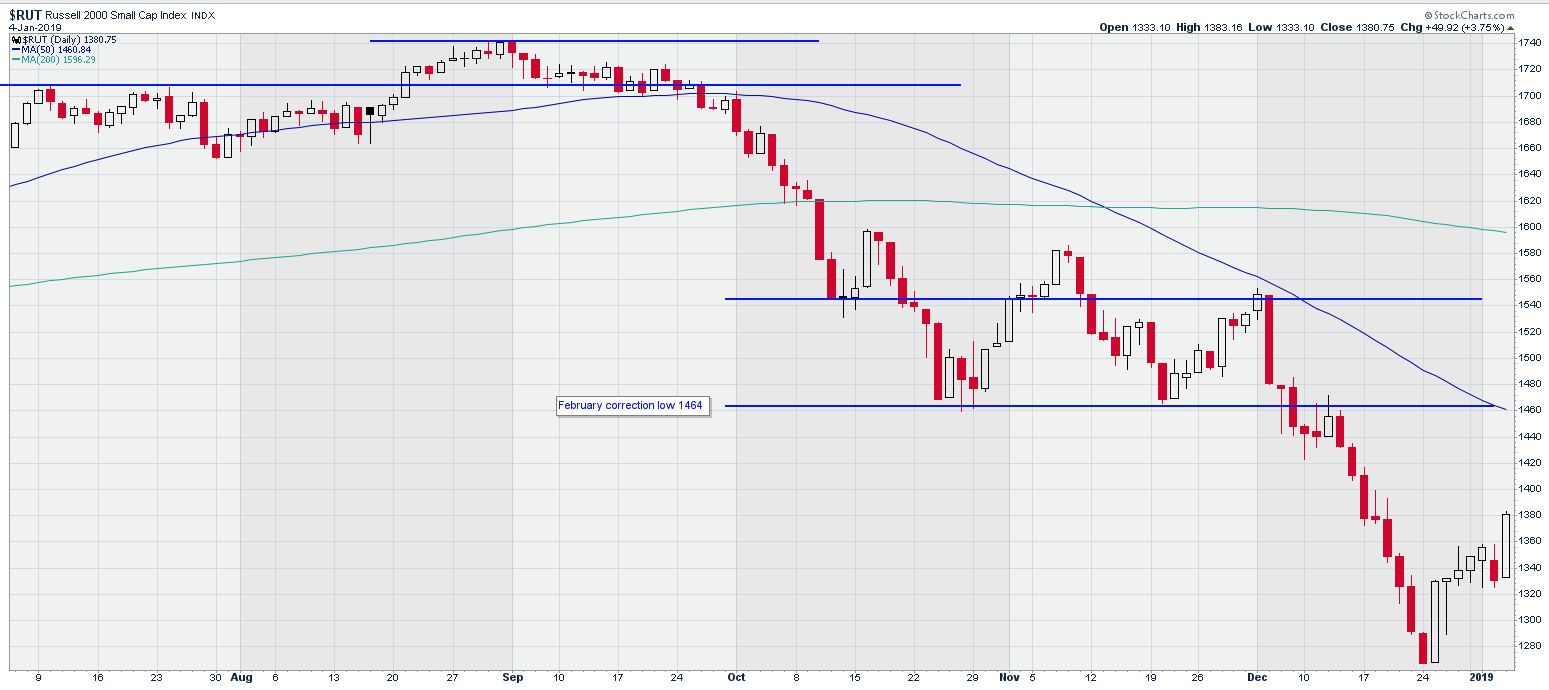
Russell 2000 Index (RUT)
Chart courtesy of StockCharts.com
The NASDAQ Composite index closed Friday at 6739, up 275 points. NASDAQ
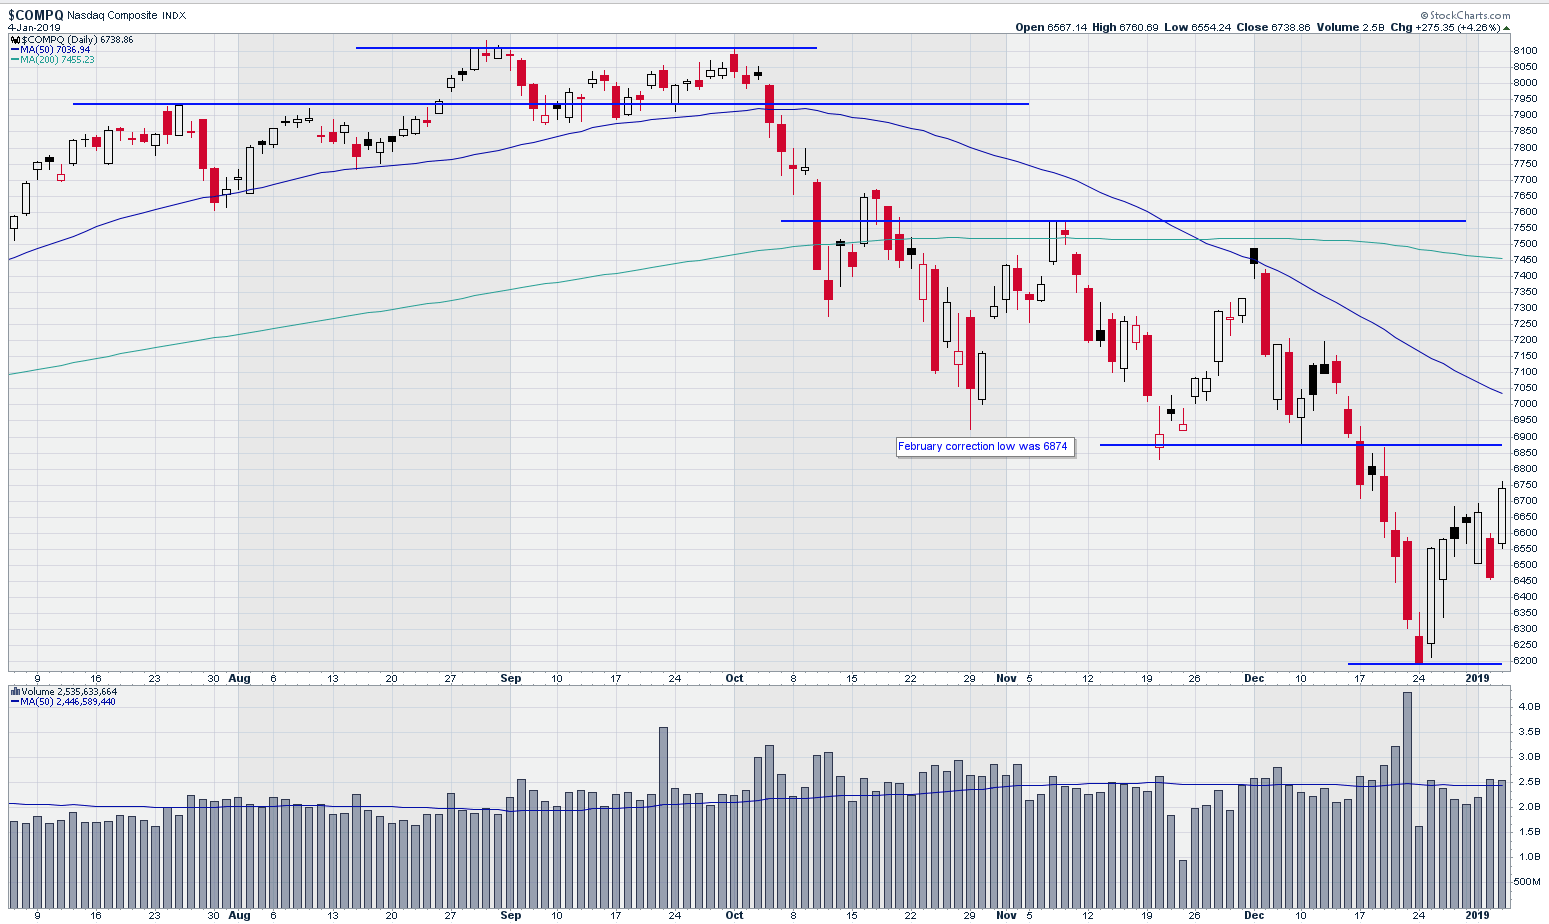
NASDAQ Composite Index
Chart courtesy of StockCharts.com
lost 23% from early October to the low on December 24. I am a little surprised that NASDAQ’s correction wasn’t the largest of any of the broad market indices given the damage incurred by many of the high-tech names in the NASDAQ.
Russell has led this correction from the beginning, trading lower and more consistently lower week after week.
Price trends since December 24 have been reassuring and the achievement of the follow through day this week probably contributed to Investors Business Daily changing their market assessment on Friday from “Market in Correction” to “Market in Confirmed Uptrend.”
I have never understood this correction from day one since it seemed to have no basis in solid economic terms. Yes, prices are higher, but companies have not grown earnings this rapidly in many years. Likewise, we have not seen GDP growth in the 3.5% range in decades.
I believe this correction was largely self-inflicted. The financial news has been infected with the rancor of the front-page news. I am amazed at how often I have heard and read the term “recession” over the past several months.
In my first economics course as an undergraduate, I learned that a recession is defined as two consecutive quarters of negative economic growth. That definition hasn't changed, and we are posting GDP growth numbers in excess of three percent. Recent GDP growth rates are light years from going negative.
Businesses are complaining that they can’t hire people fast enough. Wage growth is at historic highs, while unemployment is at historic lows. Talk of recession makes no economic sense.
Why have we turned into a crowd of Chicken Littles?
I am encouraged by the recent market trends but remain concerned about the elevated levels of volatility. I may begin to enter some trades this week, but I remain cautious. This market is going to have to show me that it has gotten over its “sky is falling” fears.
Kerry W. Given, Ph.D.
Parkwood Capital, LLC
Learn more about The No Hype Zone Newsletter
Kerry Given: Options don't have to be risky video.
Recorded: MoneyShow San Francisco August 24, 2018.
Duration: 36.34.


