
Due to the government shutdown, the CFTC did not produce a new COT report for the week so Andy Waldock, founder of Commodity & Derivative Advisors, takes a look at last week’s signals.
Due to the partial government shutdown, the Commitments of Traders (COT) report was not released. Since we have no new data with which to work, we’ll detail last week’s calls and the interplay between the daily and weekly COT signals.
We set up our daily and weekly COT signal charts with the same indicators and parameter values. The primary difference between the two is the absolute risk, in dollar terms. Both methods use the most recent extreme price as the stop-loss point. The monetary difference boils down to the bigger range of the weekly bars. Finally, as with any trading method, waiting for confirmation may increase the odds of success, but it comes at the expense of more substantial initial risk. This makes the daily signals, while not quite as accurate across the spectrum, more accessible to the retail trader due to the smaller risk per trade.
From here, we trade the daily and weekly data the same as any other multi-timeframe analysis. Therefore, when we get the daily and weekly to line up with each other, we may feel more certain about a given market’s turn while maintaining a reasonable risk profile.
Last week, we looked at the crude oil (CLV) and live cattle LCV) . We'll start with crude oil, which published a daily COT buy signal for Dec. 27. The weekly signal didn’t fire until trading began Sunday Jan. 6. Both the daily and weekly COT signals’ long recommendations came with the same protective sell stop to be placed at the swing low of $42.36 in the February contract. The swing low created an initial risk in the daily signals from $46.58 down to $42.36.
Meanwhile, the weekly signal would’ve entered on the open Jan. 11 at $48.30. Based on the generally expected holding period of the daily signal, we would have taken profits just as the weekly signal kicked in. The recent action in the crude oil market would constitute a winning trade for this mean reversion methodology.
Finally, last week’s live cattle recommendation took the loss on the daily and weekly trades last Friday when the February contract breached the previous week’s high at $124.95. The weekly entry was $121.80 on last Monday’s open while the daily COT signal entered at $123.65 on Jan. 3. The mid-week decline provided a brief opportunity to take profits at the daily level before the reversal higher.
As with any method, a large portion of its success comes down to managing risk. The inaugural week closed in the black with one loss and one win. We’ll return to making new predictions, prefaced by “Overbought/Oversold” and triggered by, “Reversal (+/-)” once we have new data.
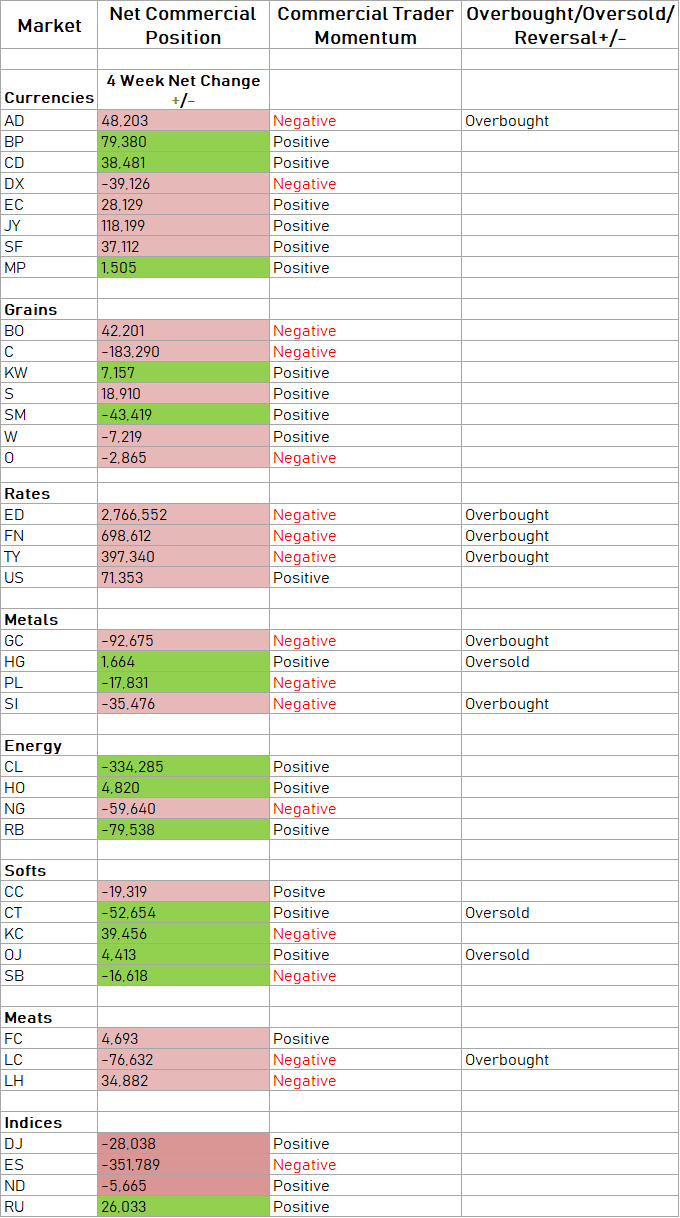
Chart explainer: Table shows net commercial position, recent movement, positive/negative momentum and whether the data shows a market is overbought, oversold or anticipates a reversal.


