
The E-mini S&P 500 is in the sell zone on the weekly chart. Traders can expect a pullback over the next week or two, says Dr. Al Brooks. He's presenting at MoneyShow Orlando Feb. 8.
After the E-mini S&P 500 rallied strongly for three weeks, the daily chart now has a parabolic wedge and the E-mini S&P 500 is in the sell zone on the weekly chart. Traders can expect a pullback over the next week or two.
The E-mini monthly chart is reversing up from bull trend line. But, the three-month selloff was particularly strong. Consequently, a trading range is more likely than an immediate resumption of the 10-year bull trend.
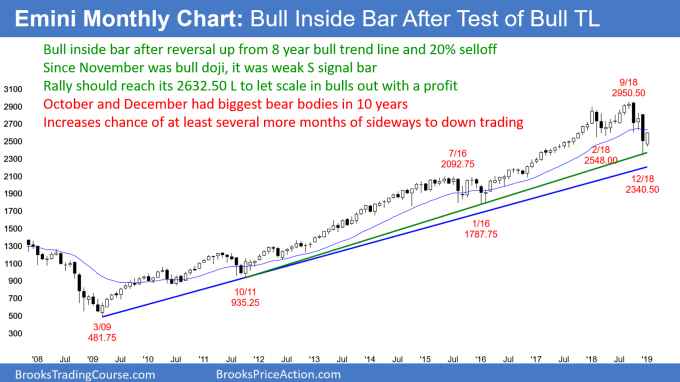
The monthly S&P 500 E-mini futures chart has been reversing up in January. December dipped slightly below the eight-year bull trend line. In addition, it reached the 20% psychological level. That is where the news declares that the stock market has entered a bear trend. However, it has reversed up sharply from that support.
So far, the month is a bull inside bar. It rallied above the February 2018 low and is therefore back in the 2018 trading range. Furthermore, it broke above the October low. The next magnet above is the November low.
Last year, the stock market was in a trading range. Most breakout attempts fail. Consequently, the bulls buy at support. They are betting that the magnet that kept the market sideways for a year will be strong enough to pull any breakout at least slightly back into the range.
There are institutions who bought the February low and scaled in lower. They needed the rally to get back to the February low, and it did. That allowed them to get out breakeven on their first buy and with a profit on their lower buys. If bulls can make money buying strong bear breakouts, then maybe the bear breakout is not as strong as traders fear.
November was a bad sell signal bar
November’s low is also a magnet for scale-in bulls. November was an inside bar above the 20-month exponential moving average (EMA). It had a bull body and a big tail below. Also, it was the first pullback to the EMA in over 20 bars. That made it a 20 Gap Bar Buy setup. It was therefore a weak sell signal bar. Consequently, it was reasonable for a bull to buy the November low with a limit order.
When a trader takes a reasonable trade, scales in, and uses a wide stop, he has an 80% chance of making money. That is the case here. Therefore, there is a strong magnet at the November low. Both the bulls and bears know that it is a magnet. The bulls keep buying until the rally reaches the target. They then take profits, which often results in a pullback.
The more important a support or resistance level is, the more potential there is for a big move up or down. In this case, the rally is testing resistance. All of the bulls who bought in 2018 are holding losing positions. If enough use this rally to exit with a smaller loss, they could turn the market down.
Many bears took profits at the support of the eight-year bull trend line. They want to sell again. Major resistance is a good location.
What traders will find out over the next several weeks is whether there are enough bulls and bears wanting to sell around 2650 – 2700 to overwhelm the buyers. If there are, the E-mini will test the December low.
But, if the rally just keeps moving up in a tight bull channel, that will encourage more buyers and sellers. The result could be a new all-time high within a few months, although this is unlikely.
Which is more certain? As strong as the rally was, it is still significantly weaker than the October and December selloffs. Unless the bulls can create strong bull trend bars in January and February, the odds are that the sellers will overwhelm the buyers. Consequently, the E-mini is currently more likely to test the December low than the all-time high.
The E-mini weekly chart has been reversing up strongly for 3 weeks. The momentum up is strong enough for traders to expect a test of the 20-week EMA (see chart).
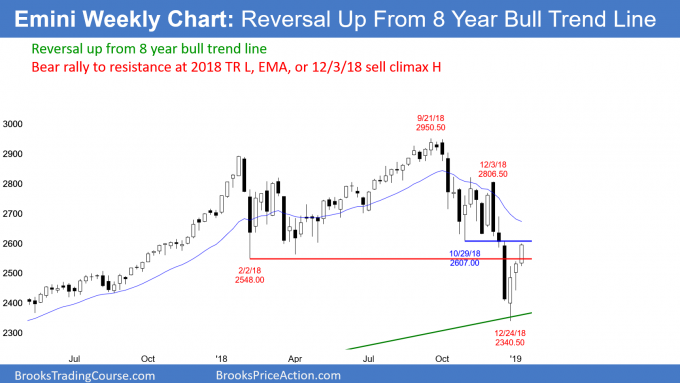
The weekly S&P 500 E-mini futures chart has reversed up for the past three weeks. Each week was a bull trend bar closing near its high. This is a sign of aggressive, sustained buying. The bulls will continue to buy until the bears can begin to create bear bars. As a result, the rally will likely go at least a little higher.
Most bears will wait for the buying to stall before looking to sell. They typically will want at least a micro double top before they will bet on a swing down. At a minimum, that would require at least two more weeks. For example, if the E-mini goes sideways for the next three weeks, it could form a micro double top.
The rally is testing the breakout points of the February, April and November lows. The next resistance is the 20-week EMA, which is above 2650.
Can the rally make it all of the way to the December sell climax high? The most recent sell climax high is always a magnet after a climactic reversal. However, at the moment, that is probably too far above for a first reversal up.
While the three-week rally is strong, it has three pushes up in a tight bull channel. That is a parabolic wedge buy climax. The exhausted bulls will probably take profits soon. The result will likely be at least a week of sideways to down trading.
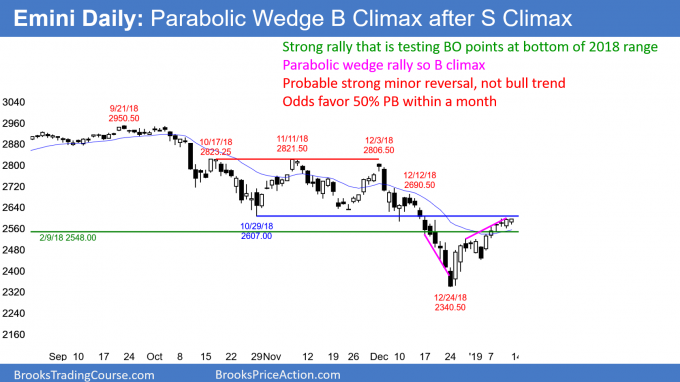
The daily S&P 500 E-mini futures chart sold off with 10 consecutive bear days in late December. That has never happened in the 100-year history of the stock market. It was therefore unsustainable and climactic. An extreme sell climax typically leads to a strong rally. That rally can go further up and last longer than what might seem reasonable.
Support becomes resistance
No rally lasts forever. This rally is now testing the bottoms of the bull legs in the 2018 trading range. Each is a breakout point for the December stock market crash. Since they formed the bottom of the yearlong trading range, they were support. Now that the E-mini broke far below them, they are resistance.
When a market breaks far below support, the first rally typically fails to hold above those levels. That support now has become resistance. This resistance zone goes up to about 2700. Unless the bulls break strongly above 2700, the best they can expect from this rally is a trading range over the next couple of months.
Parabolic wedge buy climax
The three-week rally has been in a tight bull channel. Thursday was both a pullback from the second leg up and the start of a third leg up. A strong bull trend in a tight bull channel with three legs up is a parabolic wedge buy climax.
Most buy climaxes result in exhausted bulls. They take profits and wait for about 10 bars before deciding whether to buy again. This process will probably begin within a couple of weeks. Traders are deciding if the top will be near the November low or the December 12 sell climax high. Therefore, the sell zone is between 2600 and 2700.
Targets for the bears
If the bears get a reversal down, the first target is the most recent higher low. That is the Jan. 3 low. If the E-mini gets there, the bulls will try to create a reversal up. That would be a double bottom higher low major trend reversal buy setup.
Below that, it is the December low. The bulls will buy there and try to create a double bottom. The bears want a breakout below that level and then a selloff to the 2100 level at the top of the 2014 – 2015 trading range. A reversal up there would be a breakout test.
If that does not hold, the E-mini would then probably fall to 1800. That is the bottom of the 2014 – 2015 trading range, which is a good candidate for a final bull flag.
I have been writing for over a year that the E-mini will probably get there, even if it first goes far above. This is still the case. I have been saying that the selloff would probably be within three years. In addition, there might be one more new high first.


