
“A big up move following a big down move creates big confusion,” says Al Brooks, in breaking down the technical picture of the S&P 500. He's presenting at MoneyShow Orlando Feb. 8.
The E-mini S&P 500 reversed up sharply in January and is now back in the middle of the 2018 trading range. While it will probably go a little higher, traders will look for a test down to 2,500-2,600 beginning in February. They will buy the selloff, expecting a second leg up.
The crude oil futures market rallied for six weeks after a sell climax. As strong as the rally has been, crude oil is now in a resistance zone. It will likely begin to trade down to below $50 over the next few weeks before bulls will buy again (see chart below).
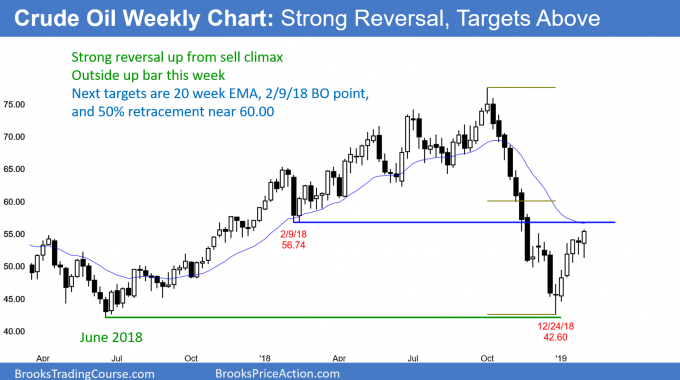
I have been writing since early December that the three-week December trading range would probably be the Final Bear Flag. I then wrote during the strong selloff in December that the daily chart would rally about $10 to the top of the December trading range.
It reached the target three weeks ago. Last week crude traded below the previous week’s low and then closed above last week’s high. This week is therefore an outside up week.
By closing above last week’s high, the odds are that the rally will continue up to the next resistance. That is the 20-week exponential moving average (EMA) and the February 2018 low. Both are around $57. Above that is the 50% retracement, which is around $60.
Can crude oil continue much higher without first testing down? Because crude oil is near a cluster of resistance points, it can pull back at any time. It will likely pull back for several weeks soon after it reaches the 20-week EMA.
When it does, it will probably retrace about half of the rally. But, when a bull trend reversal is strong, there will typically be buyers below, expecting a second leg up. Consequently, the bulls will probably be eager to buy below $50.
EURUSD
The EURUSD monthly chart has a wedge bull flag and a 50% correction. A bull breakout is more likely than a bear breakout. But, there is no bottom and no breakout yet (see chart).
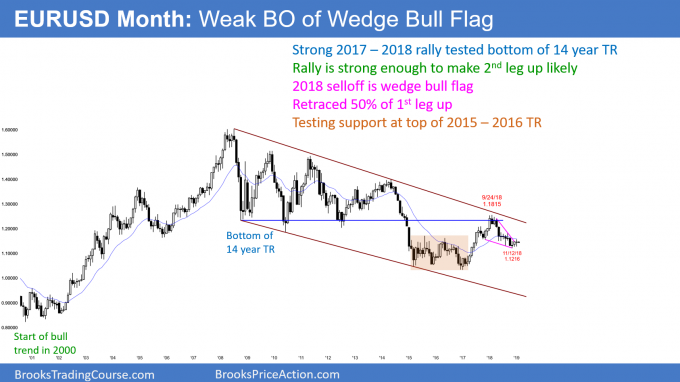
The EURUSD monthly Forex chart sold off over the past year after testing the bottom of a 14 year trading range. The rally was also a test near the top of its bear channel.
In 2018, it retraced about half of the 2017 to 2018 rally. In addition, it is testing the support of the 2015-2016 trading range high. Furthermore, seven of the past eight months have been small bars and doji bars. This represents a lack of momentum. Traders are less willing to sell at this point. The market will probably have to go higher to find a price where bears will be willing to sell.
Finally, the bulls see the selloff as a wedge bull flag after a strong bull trend. They know that the odds favor a second leg up after such a strong rally. However, there is no clear buy signal bar. Also, the yearlong bear channel is tight. Consequently, the bear channel might have to continue a little lower as it searches for buyers.
Bear trend or bull flag?
Despite the yearlong selloff, it is more likely a bull flag on the monthly chart than a resumption of the bear trend. Traders are waiting for either a strong buy signal bar or a strong breakout. They know the odds favor a bull breakout and a test of the 2018 high around 1.25. But, there is a 40% chance of a bear break below a bull flag and then a measured move down. The result would be a test of the 2017 low, just above 1.03.
Brexit might be near its resolution. The past seven months of quiet trading is due to the uncertainty over the result. The monthly chart is telling traders that whatever the result, traders believe it will probably be good for the EURUSD. But, until there is a breakout, there is no breakout. Traders have been trading. By that, I mean they are taking profits every few days or weeks and then trading in the opposite direction. There is no sign yet that this is about to change.
S&P 500
The monthly S&P 500 E-mini futures chart formed a big bull inside bar in January. It closed on its high and above the 20-month EMA. Furthermore, it retraced most of the December selloff. There are now two legs down from the all-time high. Two legs down in a bull trend is a bull flag (see chart).
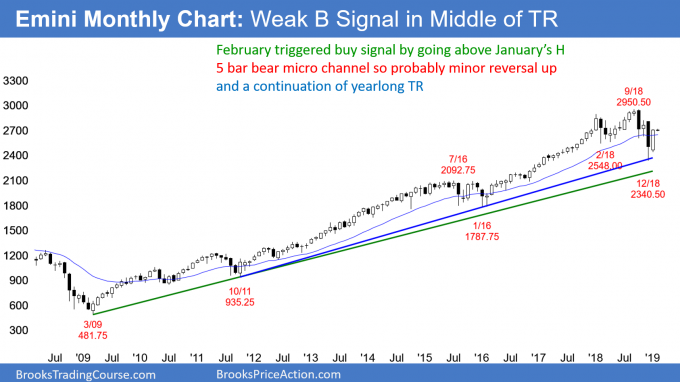
Because the monthly chart is still in a bull trend, January is a buy signal bar. Friday was the first day of February. By trading above the January high, it triggered the monthly buy signal.
However, the E-mini is now only back to the middle of its yearlong trading range. While the momentum in January was good, the October and December selloffs were also very strong.
February is the first pullback in the bear swing in five months. The first bounce typically does not get far before the market goes sideways for at least another month. Consequently, the upside over the next few months might be disappointing.
Yearlong trading range likely to continue
A big up move following a big down move creates big confusion. When traders are confused, they are confident of only one thing. They doubt either side is strong enough to start a trend. Therefore, they expect every strong move up and down to reverse instead of leading to a trend.
They therefore sell rallies and many scale in higher. Also, they buy selloffs and many scale in lower. Finally, because they do not believe that a trend is underway, they take quick profits.
When traders are buying low, selling high, and taking quick profits, the result is a trading range. Traders should expect a continuation of the 2018 trading range for at least several more months, and possibly all year.
The weekly S&P 500 E-mini futures chart has been rallying strongly for six weeks. This is after a collapse down to the eight-year bull trend line and a 20% correction.
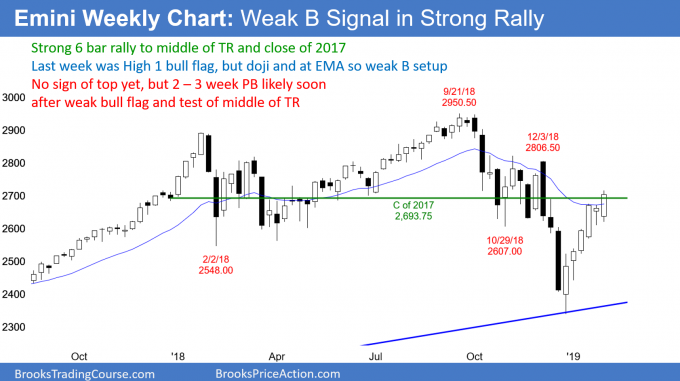
Last week was a doji inside bar. That is a weak buy signal. Typically, the rally from a weak buy signal lasts only a week or two before pulling back. Therefore, this week is important. If we see a big bull trend bar, the odds will favor a test of 2,800 and the November high before there is a pullback.
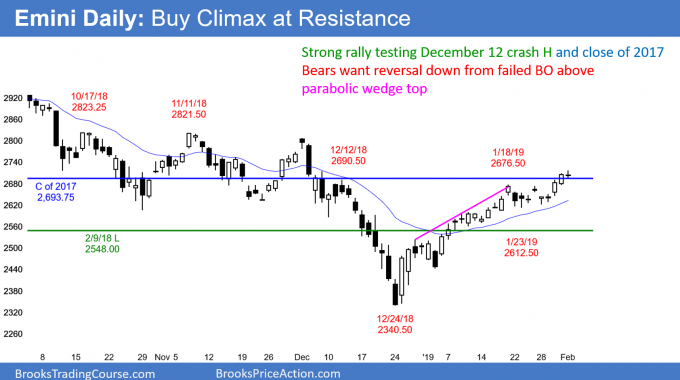
The daily S&P 500 E-mini futures chart broke above a parabolic wedge buy climax last week. But 50% of the time, when a market breaks above a wedge, it reverses down again. In addition, the rally remains in a tight bull channel, and there are still three or four legs up. Therefore, it is forming another parabolic wedge (see chart).
But, there is no strong sell signal bar yet. Furthermore, since there were consecutive strong bull bars on Wednesday and Thursday, there will probably be at least one more one-to-two day rally (which we saw on Monday and Tuesday) before the bears can create a strong sell signal bar. In addition, they will probably need at least a micro double top before a swing down begins.
Friday was a bear doji. While that is a sell signal bar, it is weak. There will therefore probably be more buyers than sellers below its low. If so and the bull trend resumes, but reverses down a few days later, the bears would have their micro double top (there appears to be setting up today).
The first leg up from the crash low could therefore end within a week. However, the E-mini could go sideways for several before turning down.
A buy climax exhausts the bulls
A parabolic wedge is a buy climax. Climaxes result in exhausted bulls. In addition, the protective stop is now far below. Therefore, institutional risk managers will become increasing concerned about giving back too much profit if there is a pullback. As a result, they will begin to tell traders to start taking profits. That results in a pullback.
When profit taking is severe or protracted, the bulls will wait until the selling stops before buying again. A reasonable goal is two legs and about 10 bars sideways to down. If the bears are unable to create a bear trend by then, the bulls will begin to buy again.
The rally is exceptionally strong. When a reversal up is strong, it typically has at least two legs up. There is no top yet, but the E-mini is in a resistance zone. It will probably begin to turn back down in February.
The pattern is similar to the buy climax on the weekly chart in January 2018. After the consecutive big bull bars, I wrote that the E-mini was likely to begin a 5% to 10% correction within weeks. It sold off 10% in February last year.
The current buy climax is on the daily chart. In addition, it is in a yearlong trading range. Consequently, traders will look for a leg down in the range for a few weeks, but not a resumption of the bear trend. Traders will be eager to buy above the December low.
As strong as the rally has been, it is still within a yearlong trading range. This usually produces multiple legs. When the first leg is protracted, like this one is, traders will look for a two- to three-legged pullback over the course of several weeks, and then a higher low.
The second leg is often about as big as the first. That will probably not be the case here. That is because the current rally has already gone 400 points. If the October, November, December triple top around 2,800 is the target for the second leg, a 400 point rally would require the selloff from the current level to fall to 2,400. That is much more than 50% and it is unlikely, given how strong the January rally has been.
Trading Room
Traders can see the end of the day bar-by-bar price action report by signing up for free at BrooksPriceAction.com. I talk about the detailed E-mini price action real-time throughout the day in the BrooksPriceAction.com trading room.


