
Al Brooks breaks down the price action in the E-mini S&P 500 on all times frames.
The E-mini S&P 500 futures is in a strong rally on all time frames. Wednesday’s big outside down day in a parabolic wedge rally and the bear body on the weekly chart make a minor reversal likely soon. It might have begun on Wednesday.
The monthly S&P 500 E-mini chart has rallied for four months after reversing up from its bull trend line. However, it is now at the top of the 16-month trading range. It has sold off twice from here in the past 16 months. Consequently, traders are not yet convinced that the rally will break strongly above the September all-time high (see chart).
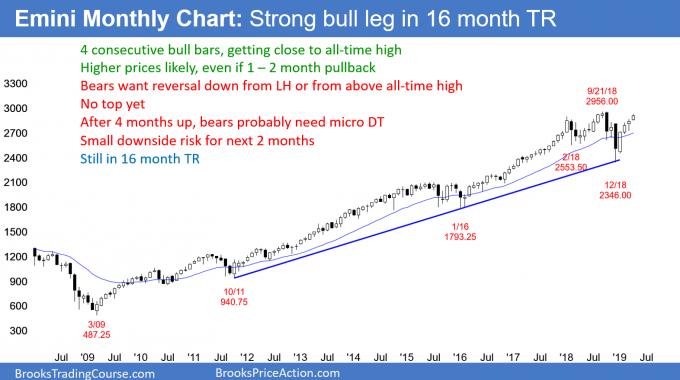
Prior to this month, the bodies of the past three months have been shrinking. This indicates a loss of momentum as the E-mini gets higher. So far, April’s body is bigger than March’s. If it is this way at the end of the month, traders will conclude that the momentum is resuming. It will make a new all-time high likely either in April or May.
But the month is only half over. This bar could look very different on April 30 once it closes.
For example, the open of the month is 2859.00, which is only about 50 points below this week’s close. A few bear days could easily drop the E-mini back below the open of the month. That would increase the chance of a one- to two-month pullback before there is a new all-time high.
While the month is good for the bulls at this point, traders should reserve judgement until the month closes.
Can the rally fail?
Most breakout attempts fail. However, this rally might be a resumption of the 10-year bull trend after a couple legs down to the bull trend line.
If there is a strong breakout to a new high, traders would look for a measured move up based on the height of the 16-month trading range. The measured move target would be 3400 or 3600, depending on whether traders are looking at the February 2018 or December lows.
If there is not a strong breakout to a new high, traders will conclude that the 16-month trading range could last many more months. A reversal down from below the old high would be the right shoulder of a head and shoulders top. If there is a reversal down from above the September high, there would be an expanding triangle top.
Since trading ranges resist breaking out, if there is a reversal down, a bear leg in the 16-month range is more likely than a strong break below the December low.
The four-month rally has been strong. Traders will expect at least a micro double top before there is a significant selloff. Consequently, the downside risk over the next couple of months is small. The best the bears will probably see is a test of 2700 before the bulls regain control.
Weekly Strength
The weekly S&P 500 E-mini chart has been in an extremely strong bull trend for four months. There have only been two pullbacks, and each lasted only one week (see chart).
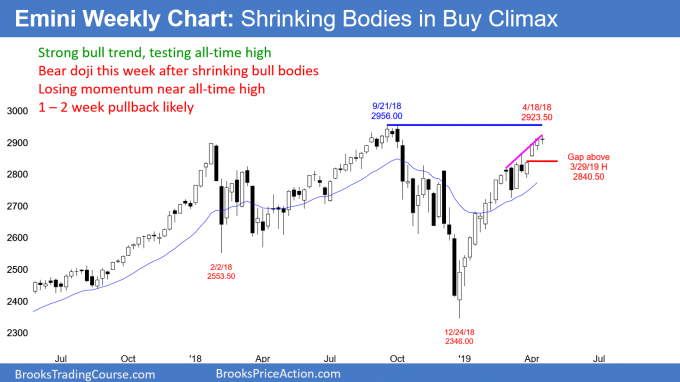
A bull trend that is in a tight bull channel like this typically has to stop going up before it can reverse lower. Therefore, the weekly chart will probably have to enter a trading range before the bears can get more than a few consecutive down weeks.
The bears tried to get a top five weeks ago. After the sell signal trigger, the E-mini reversed higher surprisingly sharply for four weeks.
Bull Surprise Bars typically trap bulls out. They were not expecting such a strong rally, and many missed the move. They now want a pullback since they expect at least a small second leg up.
Bull Surprise Bars also trap bears. They sold five weeks ago, expecting at least a few weeks down. Instead, the E-mini broke far above the high from five weeks ago. Many of these bears are now trapped into a bad short. They are hoping for a pullback so that they can buy back their shorts with a smaller loss.
With both bulls and bears eager to buy a pullback, the odds are against a bear trend reversal over the next several weeks. The best the bears can probably get is a few weeks down.
If they get it, they will then hope that the bull trend is converting into a trading range. Once it is in a trading range, they will have a better chance of a swing down.
Daily Charts Near Top
The daily S&P 500 E-mini chart has rallied in a tight bull channel for four months. The biggest pullback lasted four days. All of the other pullbacks ended after a day or two (see chart).
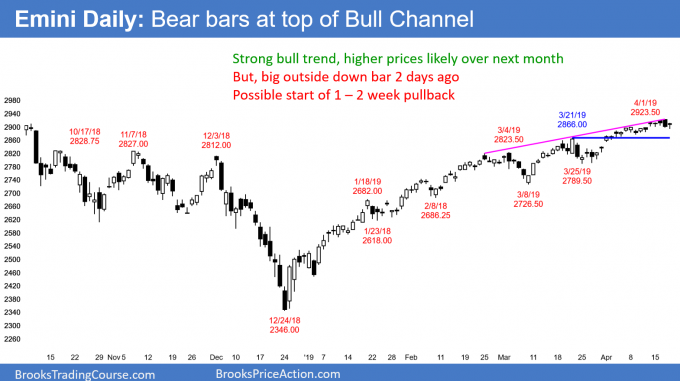
Wednesday formed a bear outside down day. It closed below Tuesday’s low. It also was the third push up in a month-long wedge rally. Wednesday was a sell signal bar. When Thursday traded below Wednesday’s low, it triggered the minor sell signal.
However, instead of a second consecutive big bear day, Thursday closed near its high. Not only is that a bad entry bar for the bears, it is now a High 1 bull flag for the bulls.
But it had a bear body. In addition, it was the fourth consecutive bear day. It is therefore a weak buy signal bar in a weak buy setup. There are probably more sellers than buyers above its high.
Is a pullback underway?
The bears need a lower high or micro double top this week. They then need a strong break below this week’s low. If they get it, traders will conclude that a bigger pullback has begun.
The first target for the bears is the March 21 high of 2866. That is the most recent breakout point. There were pullbacks below the breakout points after both the March 4 and March 21 highs. Consequently, the odds are that this breakout will pull back as well.
The rally has had three legs up since March 4. Since it is in a tight bull channel, this is a parabolic wedge rally. That is a buy climax. If there is a reversal, it will likely have at least two small legs down.
There is currently a 40% chance of a selloff to the start of the wedge. That is the March 8 low of 2726.50.
The bears have a credible start for the pullback. However, if the bulls break strong above Wednesday’s high, the E-mini will probably continue up to the all-time high before the bears try again.
Trading Room
Traders can see the end of the day bar-by-bar price action report by signing up for free at BrooksPriceAction.com. I talk about the detailed E-mini price action real-time throughout the day in the BrooksPriceAction.com trading room. We offer a two-day free trial.


