
In this market, the smaller they are, the harder they fall, writes Mike Larson.
The major averages are setting (or testing) all-time highs, trying to push convincingly past the twin peaks from January and September of 2018. But is there a fly in the ointment? Maybe.
Our Weiss Ratings coverage database is broad, deep. We track more than 9,200 stocks listed in the United States and Canada, and issue letter grade Ratings that fall into the traditional BUY, HOLD, and SELL categories. A chart of the ratio of BUYS to SELLS in our Ratings universe is nowhere near the old highs (see chart).
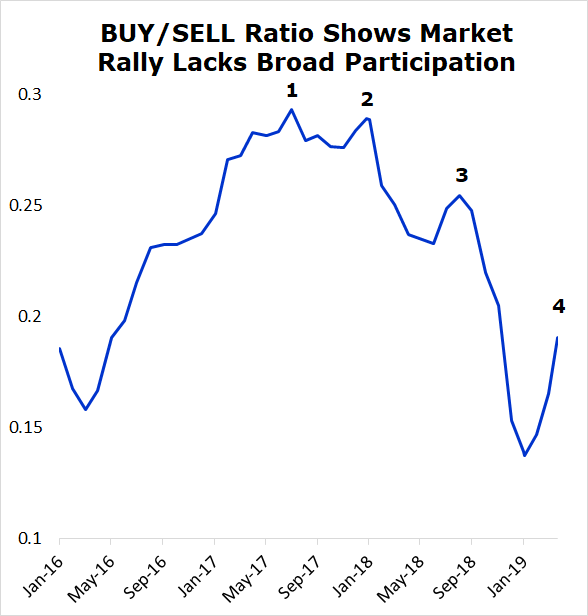
Our proprietary ratio peaked in the summer of 2017, noted with a number “1”. Then it made a slightly lower high in January 2018 (point 2), an even-lower higher in September 2018 (point 3), and (so far), an even lower high than that a few days ago (point 4). This all occurred even as the S&P 500 managed to notch slightly higher highs in each instance.
What does that tell you? The market rally isn’t broadening out. It’s narrowing. We’re seeing less and less participation among smaller stocks even as the major averages, which are dominated by larger-capitalization stocks, are pushing higher.
The chart below confirms this trend clearly. It measures how far off their highs five benchmark exchange traded funds (ETFs) were trading earlier this week: The SPDR S&P 500 ETF (SPY) rated C+, the Invesco QQQ Trust (QQQ) Rated B-, the iShares Core S&P Mid-Cap ETF (IJH) rated C, the iShares Core S&P Small-Cap ETF (IJR) rated C, and the iShares Micro-Cap ETF (IWC) rated C-. Just like their names suggest, each of the last three ETFs focuses on stocks with smaller and smaller market caps.
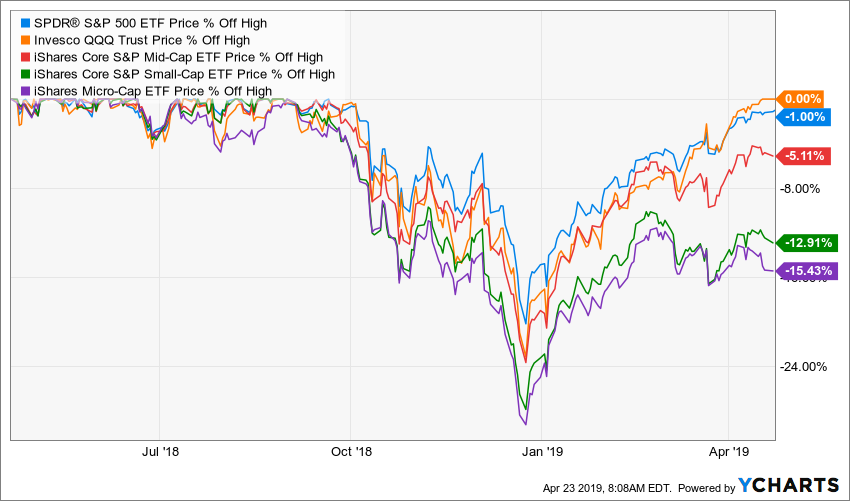
The QQQ shows a big fat “0” in the percent-off-high measure because it just notched a new record. The SPY, for its part, was only 1% off its prior peak.
But look at the IJH, the mid-cap ETF. It was around 5% below its high. The small-cap IJR was 12.9% below its high. And the micro-cap IWC was 15.4% off its high. Again, the message is clear: On average, the smaller the stock, the more it declined in the first place, and the less vigorously it rebounded afterward.
This doesn’t mean the market is 100% guaranteed to be doomed. It is possible those lagging, smaller companies will play catch up. But we haven’t seen it happen yet. And the series of lower highs and lower lows in our BUY/SELL ratio chart is somewhat troubling.
My advice? Listen to the message coming from the data. Use the Weiss Ratings as a guide for which stocks to buy or stick with, and which to sell or avoid.
That approach has worked out very well for my Safe Money subscribers of Weissratings.com


