
Technical sell signal in S&P triggered prior to fundamental weakness following Trump Tweet, notes Al Brooks.
The E-mini S&P 500 triggered an “oo top” sell signal last week when Thursday traded below consecutive outside bars on the daily chart. It will probably trade down for two to three weeks, even if there is one more minor new high first.
This is an unusual and important signal. Tuesday reversed up from below Monday’s low and reached Monday’s high. While not a traditional outside up day, it is a variant. In the Globex market, there was an actual outside up bar.
Wednesday then reversed down from above Tuesday’s high to below its low. It was therefore a second consecutive outside day (see chart). That is an “oo top” (outside, outside, or consecutive outside bars) sell signal. It is always a double top on a smaller time frame. Since it is at major resistance and in a buy climax, it is a more reliable pattern.
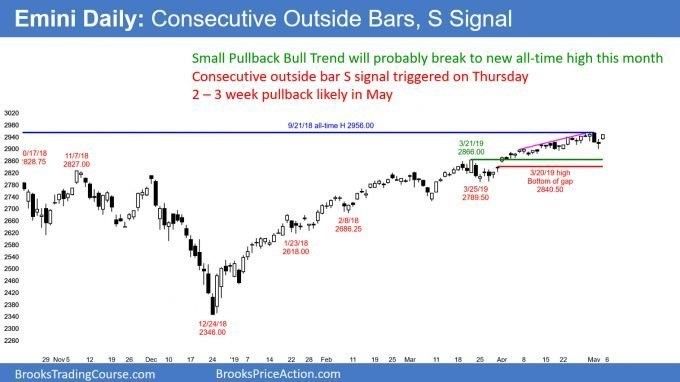
When Thursday traded below Wednesday’s low, it triggered the sell signal. Traders should expect about 10 bars and two legs down as a reasonable minimum goal. The pullback could last longer. I talk about the targets in the Weekly section below.
oo Top, but minor reversal
It is common for the market to go sideways for a few days after an oo sell signal triggers. The bulls will try to resume the bull trend. However, unless the E-mini breaks above the top of the oo (Wednesday’s high), the odds favor a couple legs down over the next two to three weeks.
Friday was a good bull day and it erased much of the bear argument. However, the oo top is still a sign of profit taking, which is likely at a prior major high. Consequently, whether or not the E-mini breaks above Wednesday’s big outside down bar, it will still probably pull back for two to three weeks in May.
Even if the pullback is surprisingly deep and tests 2700, the odds still favor a new all-time high within a few months after that. An extremely strong bull trend like the one in 2019 typically will not reverse into a bear trend without first testing the top of the bull trend. Yes, April tested September’s high. But, the 2019 rally was strong enough so that its high will also probably get tested after any one- to three-month selloff.
Monthly E-mini
The monthly S&P 500 E-mini chart had four consecutive bull trend bars closing near their highs through April (see chart below). That indicates extremely strong buying. Also, the rally was from a monthly bull trend line. Traders aggressively bought a test of support and are unlikely to give up easily. Consequently, the bulls will probably buy the first pullback. For example, if May trades below the April low, the E-mini would probably reverse back up in June.
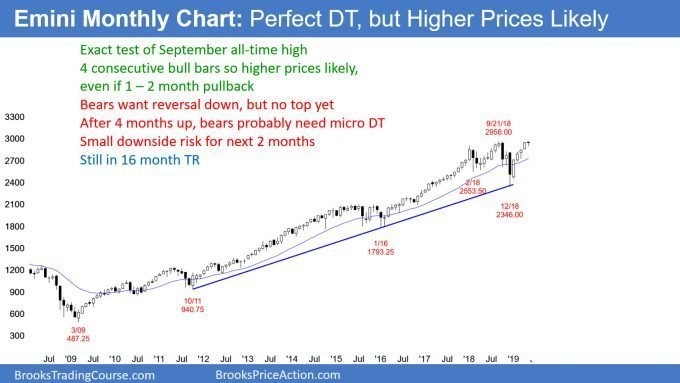
So far, the May high is an exact double top with the September 2956.00 all-time high. Perfect double tops on higher time frame charts are rare. Therefore, the E-mini will probably go above the September high within the next few months. May has only begun, and the E-mini might get the breakout within a week or two.
Expanding triangle top likely
The E-mini has been in a trading range for 16 months. Trading range breakouts usually fail. The September high and December low are examples of failed breakouts. Therefore, a break above the all-time high will probably fail within one to five bars. But this is the monthly chart. That means that the top might be several hundred points above the September high.
A reversal down from a new high would create an expanding triangle top. Some call that a megaphone pattern. The ultimate target is a break below the expanding triangle, which is the December low.
Since a triangle is a trading range, if there is a bear breakout, there will probably be a reversal up. The pattern at that point would be an expanding triangle bull flag. The target for the bulls would be a new all-time high. At the moment, that is unlikely after a 10-year bull trend. More likely, the E-mini will continue in a big trading range that could last for a couple more years.
At some point, the expanding triangle stops growing and it evolves into some other pattern. At the moment, the break to a new high will probably reverse. The reasonable objective would be about a 50% retracement of the 2019 rally. That would also be a test of the 20 month exponential moving average. At that point, traders will decide if the bull trend will resume or the reversal will continue down to the December low.
Weekly E-mini Analysis
The weekly S&P 500 E-mini chart has been in a small pullback bull trend for four months. This is unsustainable and therefore a buy climax. I wrote about this type of thing in January 2018. Back then, I said that a 5% to 10% correction would probably begin within weeks. The E-mini sold off 10% in February.
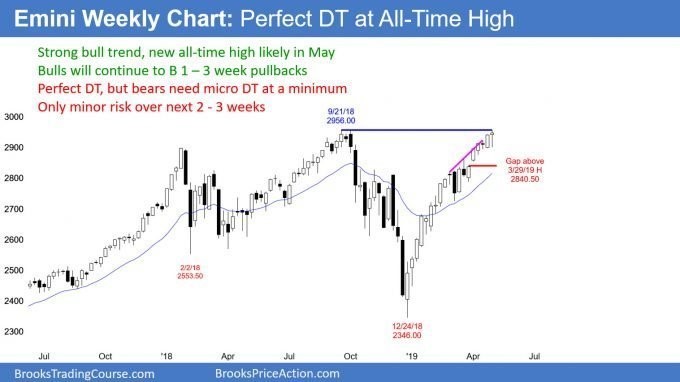
Will the current rally lead to another 5% to 10% correction? Probably not. This rally is not nearly as climactic as that one. Back then, the E-mini was the most overbought on the daily, weekly and monthly charts that it ever had been in the 100-year history of the stock market. A big exhaustive reversal was likely.
Where is support?
There are reasonable targets between 2% to 5% down from this week’s high. An obvious one is the most recent breakout point. That is the March 21 high of 2866.00. The March 29 unusually big gap at 2840.50 is another magnet just below that.
The final nearby target is the March 25 low of 2789.50. That is the start of the most recent buy climax. The bottom of the most recent buy climax is always a magnet when there is a reversal.
Can a correction continue far below that? Unlikely. The E-mini is in a tight bull channel. Traders expect the first reversal to be minor. It will therefore lead to a bull flag or a two-month trading range rather than a trend reversal.
Micro E-mini begins trading on Monday
CME Group will start trading the micro E-mini contracts on Monday (S&P, Nasdaq, Russell and Dow). The micro E-minis will be 1/10th the size of the regular E-minis. It might take a few weeks for the volume to get big. However, it will be tightly arbitraged with the E-mini and therefore it should track it closely.
The advantage is for beginning traders. There are often setups in the E-mini that require too much risk for a small account. However, the micro contract should allow most traders to stay within their comfort zone. The small size will give traders a good opportunity to learn how to trade with much less risk. They then will be better able to focus on how to trade without constantly worrying about money. That is a very good thing.
Even if the round-turn commission is only around $1, that is a problem for scalpers. In general, a trader should not take any trade where his transaction cost is more than 10% of his expected profit. If the cost is $1, a trader should not scalp for less than two points, which is $10 in the micro E-mini.
Most traders should not scalp at all. A reasonable minimum goal with the mini E-mini S&P is four points profit. For a day trader, that is a swing trade, and traders should always have swing trading as their goal.
Once they are consistently profitable, they can add scalping if they would like. However, most successful day traders are swing traders.
Perhaps the greatest advantage for smaller traders is that they can breakdown an E-mini into 10 contracts. That means that they can take a small profit and moves their stop to breakeven level and let their remaining contracts room to run. It is a strategy that many day traders used when they were able to breakdown the traditional S&P 500 future into five E-minis when they were launched more than 20 years ago.
Trading Room
Traders can see the end of the day bar-by-bar price action report by signing up for free at BrooksPriceAction.com. I talk about the detailed E-mini price action real-time throughout the day in the BrooksPriceAction.com trading room. We offer a two-day free trial.


