
The E-mini S&P 500 technical outlook from Al Brooks.
The E-mini S& P 500 futures has been sideways for four weeks. It might have begun its second leg down from its four-month buy climax. There is a 40% chance of a head and shoulders top measured move down to 2650.
The monthly E-mini S&P 500 chart has been in a trading range for 16 months. It so far has a big bear bar in May. Also, there is a double top with the September high (see chart). By trading below last month’s low, May triggered the sell signal for the double top.
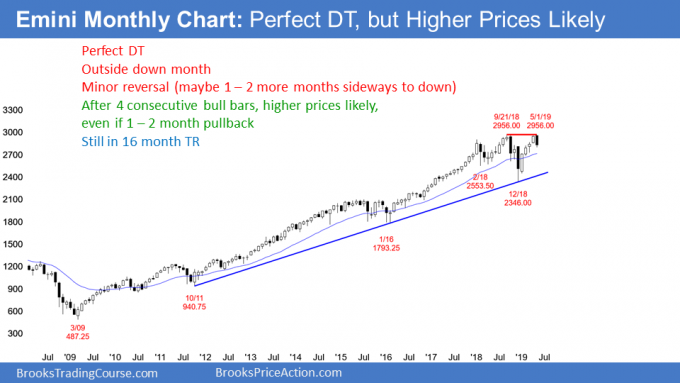
But, after four consecutive bull bars, this is a low probability short. Consequently, the reversal down will probably be minor. Traders will expect a one to three-month pullback and then another test of the all-time high.
The bears want the selloff to continue to below the December low. That is the neckline of the double top. They then want a 600-point measured move down. There is always a bear case, but this currently has only a 20% probability.
Weekly Chart Outlook
The weekly E-mini S&P 500 chart formed an inside bar last week. Its low was above last week’s low and its high was below last week’s high. Furthermore, the close was around the middle and there were prominent tails above and below.
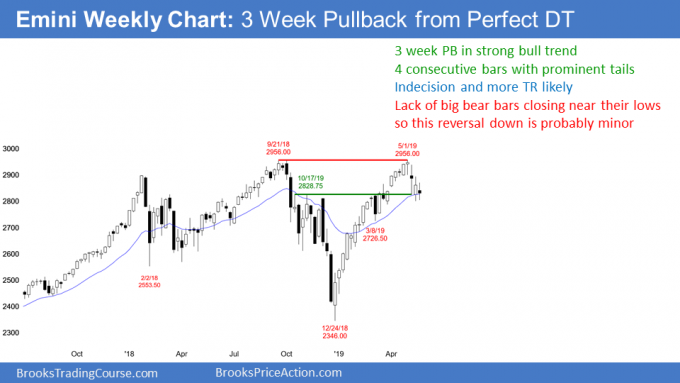
This is similar to each of the past three weeks. It represents a lack of conviction and it is trading range price action. Markets have inertia and tend to continue what they’ve been doing. There is no sign that the trading range trading is about to end. Therefore, it will probably continue for at least a couple more weeks.
The bulls hope that the past four weeks are simply forming a pullback to the 20-week exponential moving average. They see last week as a buy signal bar. However, the week had a bear body. Also, there is now a four-week bear micro channel. This is a weak buy setup. Traders expect that there will be more sellers than buyers above this week’s high.
For the bears, they have a four-week selloff from a big double top. However, they have been unable to create consecutive big bear bars closing on their lows. In fact, they have been unable to form even a single big bear bar closing on its low. This is not how bear trend reversals typically begin. Consequently, the four-week selloff is probably a minor reversal.
Daily Chart Outlook
The daily E-mini S&P 500 chart broke below a two-week triangle on Thursday. Friday was a bear trend bar and it therefore represents follow-through selling (see chart).
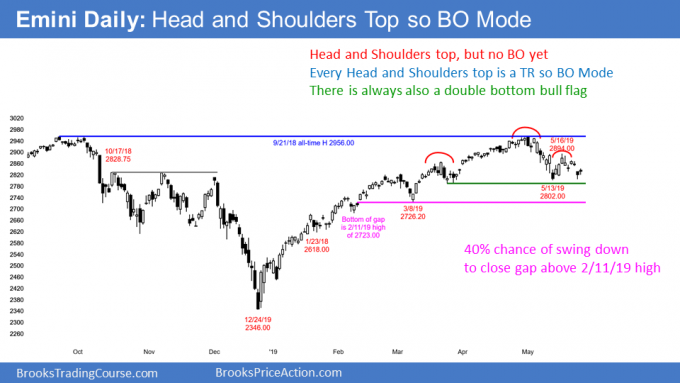
The bears see the four-month rally as a buy climax and a test of the all-time high. The May reversal down was strong enough to make a second leg down likely. Traders are beginning to think that the second leg down might have begun with the May 16 high. That is the right shoulder of a head and shoulders top. There is therefore a 40% chance of a 150 point measured move down to 2650.
However, Thursday’s low held above the May 13 low. Consequently, the bulls are hoping that they will get a reversal up this week. This would be a double bottom.
Trading range means lack of conviction
The daily chart has been in a trading range for several weeks. They are a sign of neutrality and balance. There is a lack of conviction. Traders see the price as just about right.
Trading ranges always have both credible buy and sell setups. There is currently both a double bottom and a double top. This is a breakout mode pattern. While the past two days have been good for the bears, they need a strong break below the May 13 low before traders will conclude that the second leg down has begun.
Second leg down likely
Even though the trading range is neutral, the odds continue to favor a second leg down. This is true even if there is a break above the May 10/May 16 double top first.
There is a gap above the Feb. 11 high of 2723.00. That is also around a 50% retracement of the four-month rally. It would also be about a 10% pullback. It is therefore a reasonable magnet below.
What happens if the E-mini reaches it? It will probably attract profit taking by the bears. Also, the bulls will look for a reversal up to buy.
Trading Room
Traders can see the end of the day bar-by-bar price action report by signing up for free at BrooksPriceAction.com. I talk about the detailed E-mini price action real-time throughout the day in the BrooksPriceAction.com trading room. We offer a two-day free trial.


