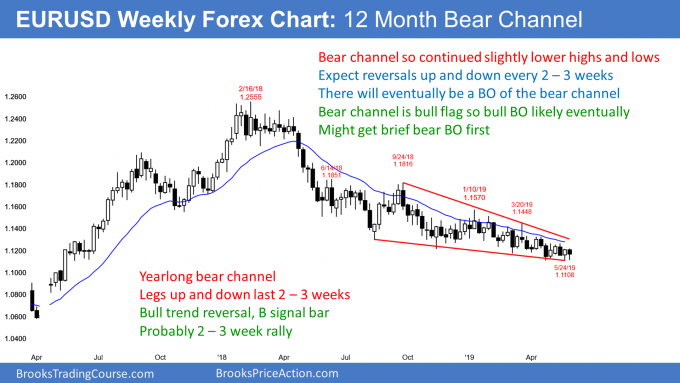
The long slow bearish channel in the euro is getting close to breakout decision, notes Al Brooks.
The EURUSD currency pair has been in a bear channel for a year. Protracted bear channels often end with a sharp break below the channel and then a reversal up. There is no sign yet that the pattern of two- to three-week rallies and two- to three-week selloffs is about to end.
The EURUSD weekly chart has been forming lower highs and lows for a year. This is a bear channel and there is no sign that it is about to end. Consequently, traders continue to buy reversals up from every new low and sell reversals down from rallies to above the 20-day exponential moving average. The legs up and down have lasted two to three weeks.

The daily chart has been in a tight trading range for a month. Every trading range has both buy and sell setups. The bears have a double top with the May 1 and May 13 highs. The bulls have a double bottom with the April 26 and May 23 low.
Because the chart is now near the 52-week low, traders are expecting a reversal up. The reversal can come from above or below the May 23 low. But, a two- to three-week reversal up is more likely that a strong break below the May low.
Possible sell climax below yearlong bear channel
When a bear channel lasts a long time, it often ends with a sell climax. There can be a strong break below the bear channel, but 75% of the time, a bear break below a bear channel reverses up within five bars.
Five bars, but on what time frame? It is the highest time frame that shows the channel. That is the weekly chart.
If traders see a strong selloff over the next few weeks that breaks strongly below the 52-week low and the bear channel, they should be ready for a reversal up. If there is a reversal up, it usually leads to a swing up. The minimum goal would be 10 bars and two legs. It could last longer and go much higher.
Since the weekly chart is in a Spike and Channel bear trend, traders will expect a reversal up to test the start of the bear channel. That is the June 14, 2018 high of 1.1851. Since that is far above, any rally would take many months to get there.
Bear channels usually evolve into trading ranges. Therefore, even if the bulls get a strong reversal up, it will probably be a bull leg in a trading range that will last a year or more.
Trading Room
Traders can see the end of the day bar-by-bar price action report by signing up for free at BrooksPriceAction.com. I talk about the detailed E-mini price action real-time throughout the day in the BrooksPriceAction.com trading room. We offer a two-day free trial.


