
The recent strength in the E-mini S&P 500 is clashing with the bearish technical outlook set in May, reports Al Brooks.
The E-mini S&P 500 broke to a new all-time high last week. June is now a buy signal bar for July on the monthly chart. If July trades above June, the E-mini will probably trade up for at least a couple more months.
The monthly E-mini S&P 500 chart in May traded above the April high and then below its low. May was therefore an outside down month (see chart).
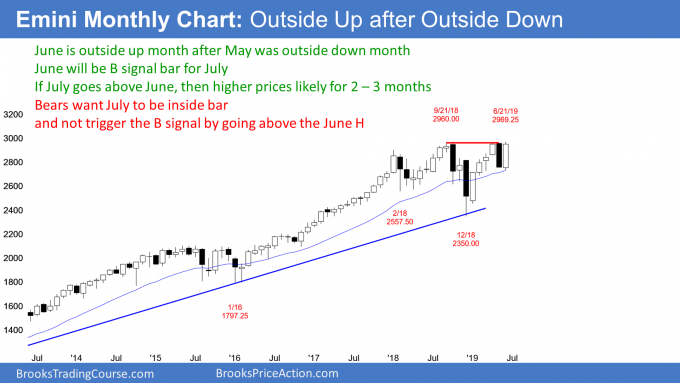
June did the opposite. It traded below the May low and then above the May high. June is now an outside up month. June is now a buy signal for July. If it closes near its high and above the May high, the probability of higher prices will be even greater. At the moment, if July trades above the June high, the E-mini S&P will trade mostly higher for at least a few months.
Why do consecutive outside bars create a setup?
When May traded below the April low, it was a sell signal bar for June. Why? Because May formed a double top with September and it closed near its low.
June triggered the sell. The bears theoretically put their stops above the May high. When June traded above the May high, it hit those stops and it ended the sell signal. Many bears will wait for at least another bar (month) or two before selling again. There are therefore relatively fewer bears at the moment. That increases the chance of higher prices if July triggers the buy signal.
If June closes near its high, it will be a strong bull trend bar on the monthly chart. Since it is in a strong bull trend, it is a buy signal bar. Many traders like to buy above strong bull trend bars when the market is in a bull trend.
What happens if July does not trade above the June high? If July does not trade above the June high, it will not trigger a monthly buy signal. For example, let’s say July trades down without going above the June high and forms an inside bar on the monthly chart. The bar before the outside bar is “inside” of the outside bar.
July would then be both a buy signal bar and a sell signal bar for August. If it closes near its low, it would be better for the bears. If it has a bull body and closes near its high, the bulls will be more willing to buy above July in August. Since this pattern is both a buy and a sell signal bar, it is a Breakout Mode setup.
Weekly E-mini Chart Analysis
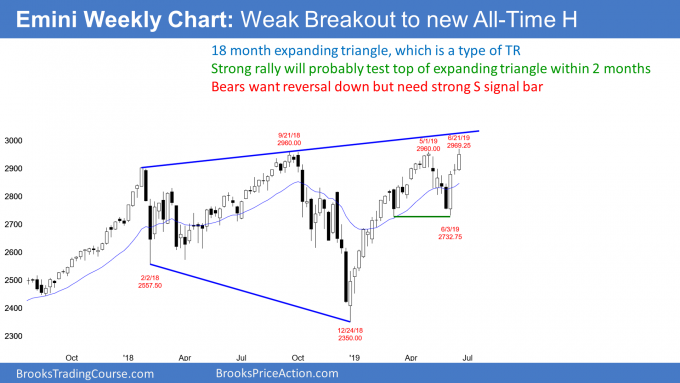
The weekly E-mini S&P 500 futures chart broke to a new all-time high this week (see chart). Any breakout can fail. When one does, it usually does so quickly. Consequently, the next few weeks are important. If this week is a second big bull bar closing near its high, traders will expect at least a small second leg up after the first one- to two-week pullback.
At the other extreme, if next week forms a big bear trend bar closing near its low, traders will conclude that this week’s breakout will have failed. The bulls would exit and the bears would short below the low of that bear bar.
The more bullish next week’s bar is, the more likely the E-mini S&P will trade higher for at least a few more weeks. A bearish bar next week will result in either a pullback or even a reversal down to the June low and 2750.
Possible Expanding Triangle top
I mentioned above that the breakout to a new all-time high can fail. If it does, it will trigger a sell signal on the daily and weekly charts before it does on the monthly chart.
What happens if the bears get a big bear bar closing near its low on the weekly chart within the next few weeks? There would then be an expanding triangle top on the weekly and monthly charts.
This is a pattern where there are two higher highs and one lower low. September went above January 2018 and reversed down. Then this month traded above September. June and September are the higher highs.
Since December fell below the February 2018 low, it formed a lower low. A reversal down in July or August would then create an expanding triangle top.
When an expanding triangle reverses, the first target is the bottom of the triangle. That is the December low of 2350.
Is a bear trend possible within a couple months? While it seems impossible at the moment, there is always a bear case. Also, its probability is typically higher than you might think. While there is currently only a 30% chance at the moment, if the E-mini begins to sell off strongly for several weeks, that probability would increase.
If the rally continues, where can traders expect profit taking? Where will a pullback or reversal begin?
The most obvious target is the 3,000 Big Round Number. The bulls might reach that next week. This is especially true since there is a seasonally bullish tendency from June 26 to July 5. This is probably due to a combination of factors, including end of the quarter buying by funds (window dressing). They want their quarterly reports to show that they own all of the strong stocks. In addition, there is some euphoria going into the summer and ahead of a holiday.
The top of the expanding triangle is the trend line drawn across the prior two highs. That line is rising and it is now just below 3030. Since strong trends tend to overshoot before reversing, traders should expect this rally to continue up as much as 2% above the line before reversing. That means around 3050 – 3150.
Measured move targets are less likely
Measured moves are often reliable, but less so in an expanding triangle. Remember, an expanding triangle means that the last four strong legs up and down reversed. Traders should expect a reversal down to at least to around the middle of the expanding triangle. It probably will begin within the next few months. Less often, the selloff reaches the bottom of the triangle, which is the December low.
The bulls are hoping for a measured move up based on the March 8/June 3 double bottom at around 2730. The neckline for the double bottom is the May 1 high of 2960.00. A 230 point measured move up is 3190. That is above what most pundits are predicting. Also, it would be unusual when there is an expanding triangle.
Can the rally reach a measured move up based on the 600 point height of the 18-month trading range? Probably not, because of the expanding triangle’s strong tendency to reverse shortly after every new high or low. That measured move target is around 3550.
Daily E-mini Technical Analysis
The daily S&P 500 E-mini futures chart broke above the September/May double top this week. Traders know that any breakout has at least a 40% chance of failing. Therefore, the bulls will exit and the bears will sell if this breakout reverses down within the next couple of weeks (see chart).
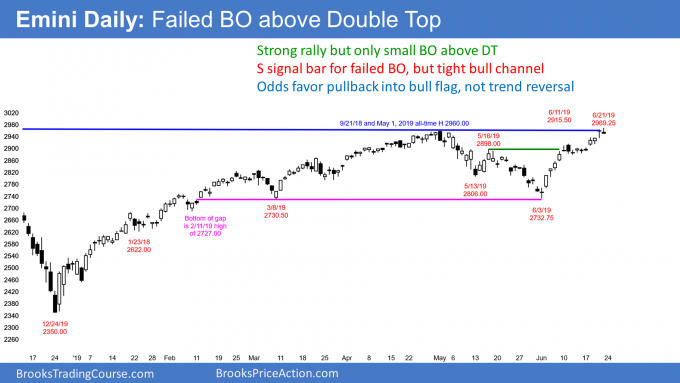
Since Friday closed on its low, it is a sell signal bar for today. The tight trading range from two weeks ago is a magnet and a potential Final Bull Flag. It is therefore a target if this week trades down.
But even if it does, the odds still favor higher prices in July. This is because the June rally has been very strong, as was the January to April rally. Also, the trend line at the top of the expanding triangle is a magnet above.
In addition to Friday being a sell signal for a failed breakout above a double top, the rally is also a wedge. The May 16 and June 11 highs would be the first two highs in a wedge and Friday was the third. The reversal down would be from a wedge rally and a higher high major trend reversal.
It is important to note that even the best looking major trend reversal has only a 40% chance of reversing a trend into an opposite trend. More often, the reversal either forms a trading range or a bull flag. Therefore, the downside risk next week is small.
Trading Room
Traders can see the end of the day bar-by-bar price action report by signing up for free at BrooksPriceAction.com. I talk about the detailed E-mini price action real-time throughout the day in the BrooksPriceAction.com trading room. We offer a two-day free trial.


