
The S&P 500 has a rare outside-outside bull flag, but technical could get Trumped by trade news.
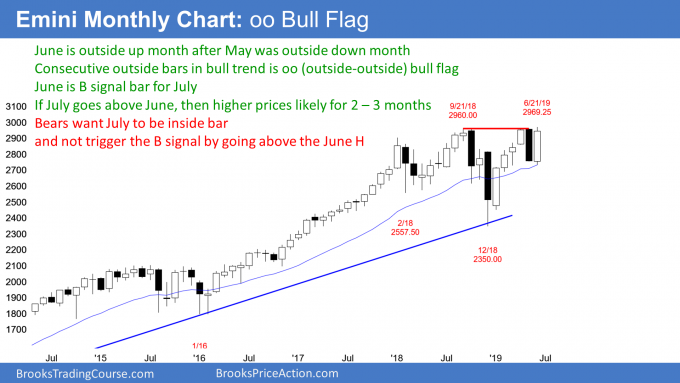
The June bar on the monthly E-mini S&P 500 candlestick chart has created an “outside-outside (OO)” bull flag with May. However, if July does not go above the June high to trigger the buy signal, July will be both a buy and sell signal bar for August.
The monthly E-mini S&P 500 futures is currently the most interesting because it has two fairly unusual patterns. There is both an OO buy setup (consecutive outside bars) and an expanding triangle top (see chart).
Outside-outsdie bull flag
When the market is in bull trend and forms an outside down bar and then an outside up bar, that is a set of consecutive outside bars. I call that an OO bull flag. May traded above the April high and then below its low. May was therefore an outside down month and a sell signal bar for a top in a bull trend.
June traded below May to trigger the monthly sell signal, but then rallied to go above the May high. It therefore hit the protective stops of the bears who sold below May’s low.
June is now a buy signal bar. If July goes above the June high, it will trigger the OO bull flag buy signal. There would then be a 60% chance of higher prices over the next few months.
Inside-outside-inside
If July does not go above the June high, July will probably be an inside bar. This is because the June low is so far below that the odds are against July falling that far. An inside bar after an outside bar is an inside-outside-inside (IOI) setup. The bar before an outside bar is inside of the outside bar. That is why I call it an IOI pattern.
An inside bar in a bull trend is a buy signal bar. Consequently, if July does not trigger the buy signal above the June high, July will be a buy signal bar for August.
Remember, when June traded below May, it triggered a sell signal, even though it failed. If August trades below July, it would be a second reversal down from the top of the 18-month trading range. That is a higher probability sell signal than a first reversal down. Therefore, an IOI is also a sell signal as well as a buy signal.
When a bar is both a buy and sell signal bar, there is a Breakout Mode pattern. In general, traders assume that a Breakout Mode pattern has a 50% chance of a successful bull breakout and a 50% chance of a successful bear breakout. Furthermore, there is a 50% chance that the first breakout up or down will fail.
Expanding Triangle Top
When many traders think of a triangle, they see a pattern that is constricting, getting ever tighter, with a series of lower highs and higher lows. The theory is that the tension is building up and that there will be a breakout that will go about the same distance as the height of the triangle. This contracting triangle is the most common type of triangle.
But the mirror image of that is a triangle as well. If a market makes a sideways series of higher highs and lower lows, it is a triangle that is expanding instead of contracting. This is a reversal pattern and not a breakout pattern. Traders expect each new high to reverse and then make a new low, and then reverse up to a new high. At some point, the pattern stops, and market moves onto some other pattern.
The monthly chart made a high in January 2018 and then a low in February 2018. That was followed by a new high in September and a lower low in December. The June rally went above the September high (which was a double top with the May 2019 high).
If the E-mini reverses down from here, that would be the fifth reversal and it would create an expanding triangle top. The goal for the bears is a new low in the pattern, which means a break below the December low. If the bears get a good sell signal bar in the next few months, they will have a 40% chance of a break below the December low.
That means that even with a good sell signal, there is a 60% chance of something else. The most likely possibility is a continuation of the 18-month trading range.
How far will the rally go?
The E-mini has been in a trading range for 18 months. When there is a breakout of a trading range, traders look for a measured move that is based on the height of the trading range. Since this range is 600 points tall, the bulls want a rally to 3,500 and the bears want a selloff to 1,700. Both are currently unrealistic. This is because this trading range is an expanding triangle. That means breakouts are more likely to reverse than to lead to a measured move.
When a market is in an expanding triangle, traders can extend the lines above and below. The rising line above is resistance and the falling line below is support. If the bulls trigger their buy signal in July, the top of the triangle is currently around 3,040 and it is rising.
Expanding triangles typically go beyond the lines before reversing. These are overshoots and 1% to 2% overshoots are common in the stock market. That means that the E-mini might reach 3,100 before reversing. Therefore, traders should look for a reversal down from between 3,000 and 3,100.
The first reversal down typically targets the most recent major higher low. That is the June 3 low of 2732.75.
Weekly Confusion
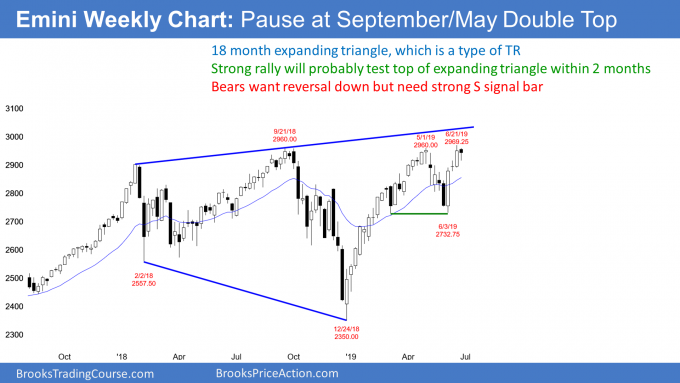
The weekly E-mini S&P 500 chart formed a bear inside bar this week. It is therefore a sell signal bar for next week for a failed breakout above the May high.
However, the three-week rally has been strong. In addition, the 2019 bull trend has also been strong. Consequently, there probably will be more bulls looking to buy below this week’s low than bears eager to sell there. This is therefore a low probability sell setup.
If next week triggers the sell signal by going below this week’s low, it will probably form a bull flag over the next few weeks instead of beginning a bear trend. The odds continue to favor a new all-time high in July.
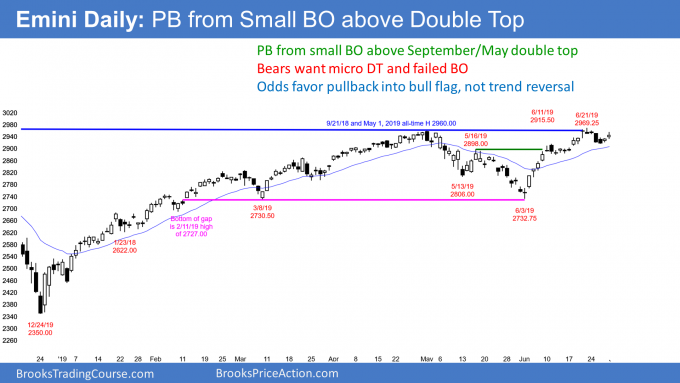
The daily E-mini S&P 500 chart bounced on Thursday and Friday after four bear days. Since the 20-day exponential moving average is always support, it is a magnet. Wednesday’s low got to within 20 points. It is therefore within the magnetic field. That makes it unlikely to go back to the all-time high without first getting down to the exponential moving average.
The tight trading range that ended on June 17 is an area of agreement. It too, is therefore a magnet. The selloff got halfway there.
A 50% pullback is common. The market often pauses halfway to a target as it decides between continuing down to the target or resuming up to a new high.
While traders assume that every reversal attempt will fail and form a bull flag, the 20-day exponential moving average and tight trading range are strong magnets below. Many bulls will not want to buy until they see the E-mini fall to that support and reverse up. As a result, it is likely that the E-mini will test 2900 before making a new high.
The U.S.-China trade talks this past weekend are unusually important. Most traders correctly assume that there will be no surprise. That means the technical factors will remain in control and there will not be a big news-related move on Monday. But if there is a surprise, it could overwhelm everything. The E-mini could make a huge move up or down on the news.
Trading Room
Traders can see the end of the day bar-by-bar price action report by signing up for free at BrooksPriceAction.com. I talk about the detailed E-mini price action real-time throughout the day in the BrooksPriceAction.co-m trading room. We offer a two-day free trial.


