
Bitcoin has seen as impressive gain of 309% in a Parabolic Arc fashion, which is due to reverse, writes Suri Duddella.
In the first six months of 2019, Bitcoin has seen as impressive gain of 309% in a Parabolic Arc fashion, rising from a low of $3,100 to a high of $13,800. In recent weeks, Bitcoin has seen a corrective move after Facebook's Crypto Chief's senate hearing. A string of queries by the U.S. Senate about Facebook's Libra project and its responses set Bitcoin on a serious slide from its parabolic rise. It pretty much wiped off its last quarters gain in seven days.
Bitcoin's transaction volume has been steadily rising in 2019 and reached the December 2017 volume of 400,000 transactions. This steady growth is showing the signs of maturity and the increase in adoption rates. Facebooks' Libra project could bring a fundamental change of the ideal concept of Bitcoin and cryptocurrencies in general and bring some legitimacy and credibility to the cryptocurrency market. It also brings some criticism and pushback from governments, regulators and central banks. Regardless, Facebook (FB) may be on the verge of major history and could potentially see a big rally in its stock prices along with Mastercard (MA), Visa (V) and PayPal (PYPL).
In 2019, Bitcoin has been trading in a Parabolic Arc pattern in an overbought condition. It is expected that Bitcoin may see a healthy pullback to relieve the overbought condition to set a long-term rally.
Parabolic Arc Patterns
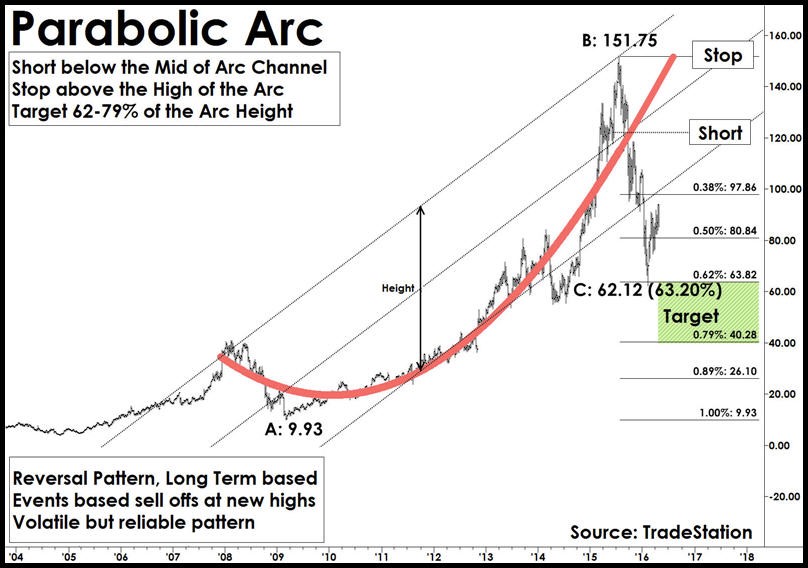
Parabolic Arc chart patterns form when a steep rise in prices caused by irrational buying and intense speculation. Parabolic Arc patterns are rare, but they are reliable and are generated in mega bull trends. These patterns trend gradually making higher highs and lower lows in the beginning stages but can be volatile in the exhaustion and reversal stages. Irrational buying in public generates a strong rally to push prices vertically, followed by a steep sell-off. Examples of these market types are the NASDAQ bullish markets during 1990-2000 (retraced 80%) and Gold prices from 2000-2011 (retraced 62%).
The Parabolic Arc is a reversal pattern and has a very predictable outcome. Although these patterns are predictable, they are relatively difficult to trade since the market sentiment is bullish and may be tough to pinpoint reversals to trade. Most Parabolic Arc patterns have a significant correction of 62-79% of its price rise (from the top).
Trading Parabolic Arc Patterns
Trade: In Parabolic Arc patterns, prices move up vertically and eventually, the acceleration comes to a stop and then reverses (see chart above). Prices start showing lower-lows and may attempt to regain the top again. Draw a channel connecting the top and bottom of the pattern. Enter a “short” trade at the breakdown of the channel trend line connecting the pattern high and pattern lows.
Target: Measure the distance of the rise from the base to the top of the pattern. Most Parabolic Arc patterns return 62% to 79% of its rise. The first target should be a 50% retracement.
Stop: Protect the trade by placing your stop a few ticks above the high of the Parabolic Arc.
Bitcoin Parabolic Arc
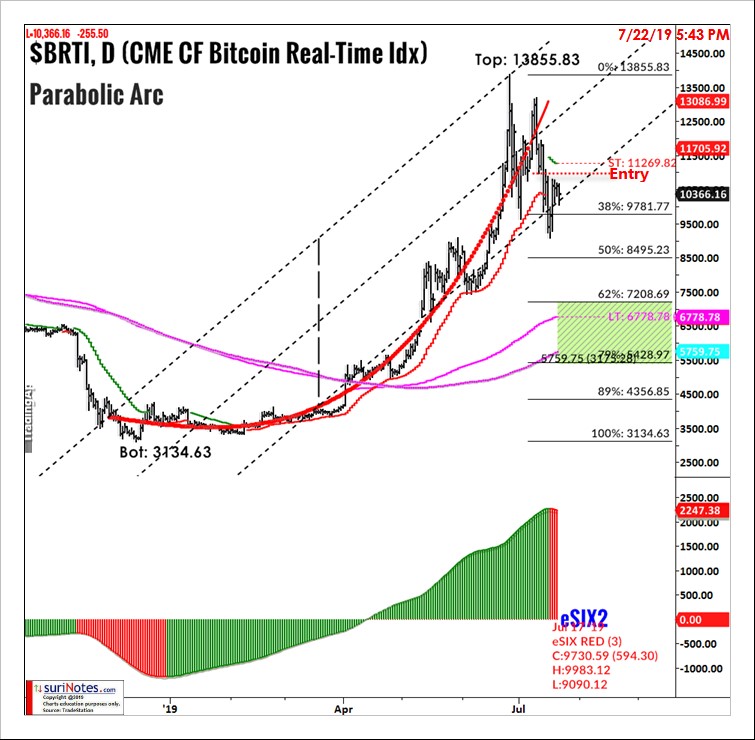
The following chart shows the Parabolic Arc pattern formation in Bitcoin. In 2019, Bitcoin rose from a low of $3,134 to a high of $13,855 in a Parabolic Arc pattern. Price closed below the mid-channel around $11,400 and confirmed the underlying bearish trend. The Parabolic Arc targets are $8,495 (50%), $7,210 (62%) and $6,430 (79%). The stop is above $12,500.
Find more of Suri’s work at surinotes.com.


