
Divergences between large caps and small caps as well as volatility measures suggests equities could be facing a major turn, reports Joon Choi.
The Federal Reserve Board embarked on normalizing the short-term rates with a 0.25% hike in December 2015 and followed that up with eight additional increases. The rate hike in December 2018 is most scrutinized as it occurred during a sharp equity selloff. Fed chairman Jerome Powell quickly backed off his aggressive stance on further rate hikes this year. This sudden policy reversal led to a sharp drop in long-term yields which benefited both equity and bond markets.
The Fed Fund Futures market is pricing in a 100% chance of the first rate cut since 2008 at the July 31 FOMC meeting. Furthermore, investors seem to be expecting further interest rate easing as the CME FedWatch Tool is assigning an 88% probability of at least one further rate cut (of course this provides no assurance the Fed will act accordingly, just as any futures market is not bound by the current price on its expiration date. If that were true, there would be no need for markets!)
The expectation of two rate cuts in 2019 has served as a tailwind for the equity market since June. So, what happens after the Fed indeed meets the market’s expectation of a rate reduction on July 31? It may be a case of “buy the rumor and sell the news”.
Small cap and Transportation stocks are lagging
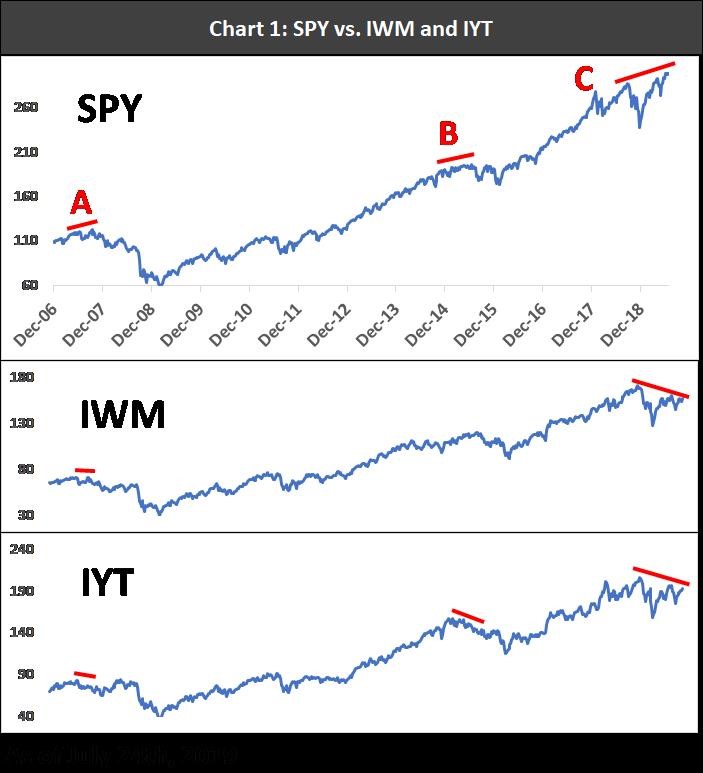
As the SPDR S&P 500 ETF Trust (SPY) made new all-time highs yesterday, there are two important investment categories that have lagged SPY. The small-cap iShares Russell 2000 ETF (IWM) and iShares Transportation Average ETF (IYT) have yet to make new highs. In fact, IWM is 8% off its highs and IYT is 6% away.
While SPY made new highs in 2007, both IWM and IYT made lower highs which led to a sharp selloff (Point A in the chart below). Prior to two 10%+ corrections in 2015 and 2016, SPY had diverged from IYT (Point B). Lastly, Point C indicates the current situation where IWM and IYT continue to make lower highs while SPY made new highs (similar to 2007 but with an even greater divergence now).
Under normal circumstances the Cboe Volatility Index (VIX) tends to fall as the S&P 500 Index (SPX) rises, which can be seen in their -72% correlation with one another. However, there are times that the stock market and VIX tend to trend in the same direction. The chart below displays the S&P 500 Index and the VIX since 1999. The VIX is inverted to better show the divergences and convergences between the S&P 500 and VIX. (VIX falling in the chart actually means its value is rising.) SPX and VIX diverged against each other prior to the Financial Crisis (Point B) and in 2015 (Point D). Most importantly, they have been diverging for the past 19 months which raises a caution flag (Point G).
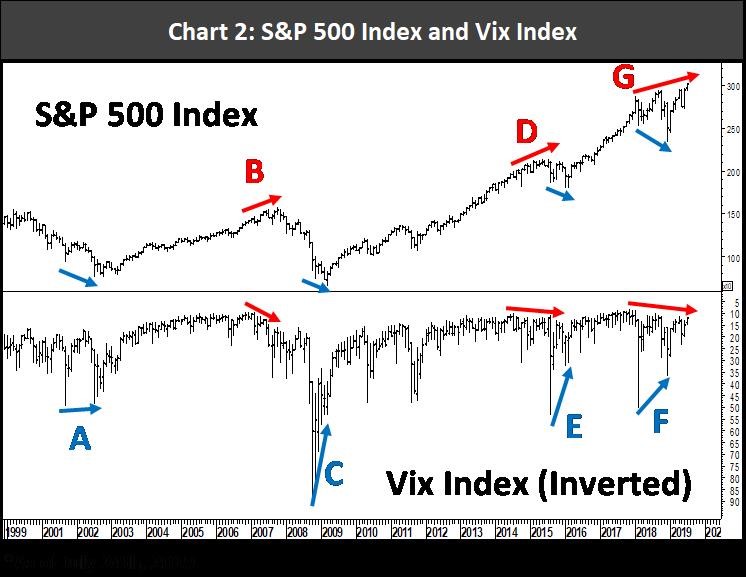
This analysis seems to show that SPX converging with VIX (meaning SPX falling with VIX), seems to indicate a major stock market bottom is ahead, as was the case in 2002 (Point A), 2009 (Point C), 2016 (Point E) and 2018 (Point F).
Conclusion
The stock market bounced sharply so far in 2019 as the Fed halted raising short-term rates and may soon cut rates in response to the global economic slowdown. It’s likely that the potential benefits from the reduction in rates are already baked into current equity prices. Small cap and transportation ETFs suggest the current rally may not be sustainable. In addition, option premium is trending higher along with the stock market, which may be a bad omen for equities. It may be prudent to have less equity exposure in the next few months.


