
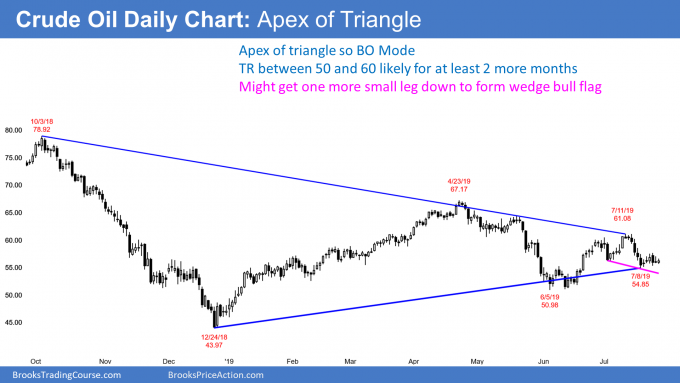
Crude oil is at the apex of a nine-month triangle. It might have to fall below last week’s low before testing $60 again, suggests Al Brooks.
Crude oil futures has been in a trading range for more than three years. Since October 2018, it has two lower highs and two higher lows (see chart below). A contracting trading range with five or more legs is a triangle, which is a Breakout Mode pattern. Traders believe that the odds of a successful bull breakout are about the same as for a successful bear breakout. A successful breakout is one that has at least a couple legs and lasts 10 or more bars.
When a market is in Breakout Mode, there is a 50% chance that the first breakout, up or down, will fail and reverse.
The daily chart has been sideways for seven days. Traders are deciding if the third leg down is complete, or if there will be one more push down for a few days.
If there is and there is then a reversal up, there would also be a wedge bottom with the July 3 and July 19 lows. That would increase the chance of a rally back up to the July high and $60 over the following couple weeks.
I have suggested all year that crude in 2019 would enter a trading range within the larger three-year trading range. This is because there was a big rally until October 2018 and then a big selloff until December 2018. Big up, big down moves create big confusion.
When traders are confused, they are confident of only one thing. They do not believe any move up or down will get far. They therefore look for reversals and take quick profits. When traders buy low, sell high, and take quick profits, this creates a trading range.
Reversals within a range are often not clear. When that is the case, traders like to see second signals. For example, there was a double bottom in June. In July, there was a higher high double top, and the second leg up also had a micro double top.
Tight trading range is a Limit Order Market
Crude has been in a tight trading range over the past seven days. That means traders are buying near the prior day’s low and selling near the prior day’s high.
This is a limit order market, which is bad for traders utilizing stop losses. It is usually better to wait for a strong breakout up or down and then enter in the direction of the breakout via a stop.
Alternatively, wait for a breakout up or down that reverses, and enter in the direction of the reversal. This is what traders should expect for at least another week.
Trading Room
Traders can see the end of the day bar-by-bar price action report by signing up for free at BrooksPriceAction.com. I talk about the detailed E-mini price action real-time throughout the day in the BrooksPriceAction.com trading room. We offer a two-day free trial


