Silver broke out of a recent descending triangle pattern, reports Suri Duddella.
Silver rose more than 11% in the past month as precious metal investors are excited about the prospect of higher prices for gold and silver.
Silver started outperforming gold in the last couple weeks in an attempt to catch up with gold’s summer rally, which silver did not participate in. Some analysts believe the current silver rise could be the most explosive silver rally for the last 50 years.
Gold and silver had been the currency of the financial system of many old Governments as a legal tender. Gold futures are hedging tools for commercial producers and gold users. Gold is widely viewed as a safe-haven asset in times of uncertainty and primarily used for portfolio diversification or alternative to investing in gold bullion/coins or gold mining stocks.
After the June FOMC meeting, gold broke above $1,300 and rallied to $1,460. After a few weeks, silver caught on to the gold rally and started to rise from a breakout level of $15.15 to $16.60. During the silver rallies, investors tend to look for silver related companies, silver miners and ETFs like Global X Silver Miners (SIL), ETFMG Prime Junior Silver (SILJ) and the iShares Silver Trust (SLV) as they outperform the silver futures.
Trading Silver
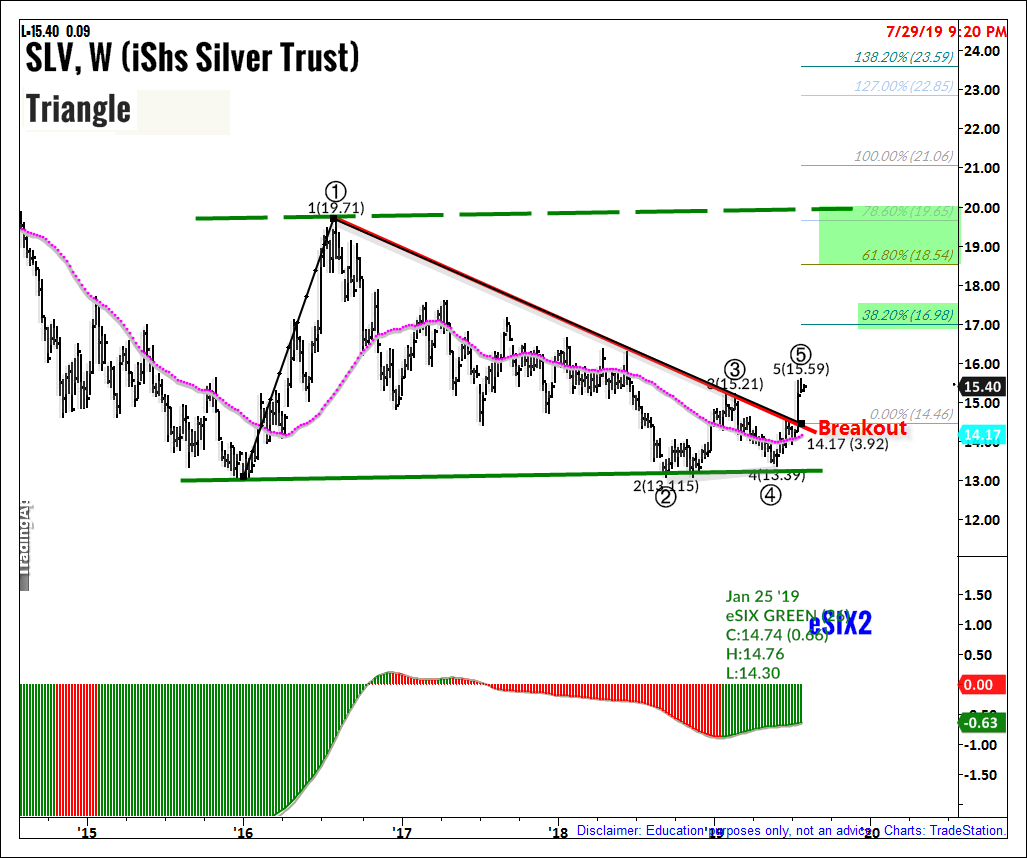
Looking at the SLV weekly chart shows it broke out of the Triangle Descending formation. Triangles can be characterized as areas of indecision. Market price-action pauses during these indecision periods as prices trade in a consolidation phase. Volume tends to be diminished during consolidation phases. Eventually, a resolve (breakout or breakdown) from the upper or lower trend lines will result, and prices will explode out the triangles. Usually, triangles break in the direction of its prior trend, hence signifying its Continuation Pattern status. However, in many cases triangles produce a reversal pattern after its initial breakout in the opposite direction, giving the trader the opportunity to trade the opposite of the pattern.
SLV has been trading in a consolidation pattern since 2016. SLV attempted to close above its 200-day moving average as a breakout a few times but still traded below the upper trendline. In July 2019, SLV traded out of the triangle pattern (breakout) from $14.50. A measured range target is computed from its breakout level. A long trade is entered at $14.50, and its targets are set at $17 and above that at $18.50. A tight stop is placed below the 200-day moving average at $14.