
The E-mini S&P 500 sold off after Fed Chair Jay Powell failed to signal a wider easing regime and again after President Trump announced additional tariffs on China, but it is unlikely the correction is a sing of a long-term top, according to Al Brooks.
The E-mini S&P 500 futures just had its first pullback on the weekly chart in eight weeks. The selloff will probably last at least a couple more weeks and end between 2800 and 2900. However, the month chart tells a little different tale.
The monthly E-mini S&P 500 futures broke above consecutive outside bars in July. That is a buy signal with a 60% chance of three months of sideways to up trading (see chart).
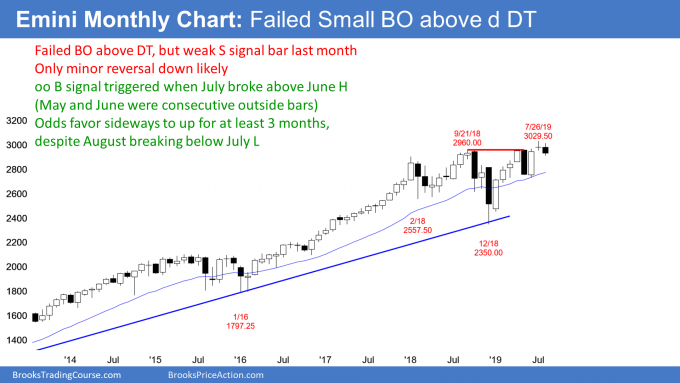
The bears see July as the third leg up in a 19-month expanding triangle top. In addition, they hope that the breakout above the September/May double top is failing.
July was a small bar on the weekly chart. Because it closed below its midpoint, it is a sell signal bar for August. When Thursday, Aug. 1, traded below the July low, it triggered the monthly sell signal.
But a small bear doji is a weak sell signal bar. Also, the context favors sideways to up trading into at least September. Consequently, there will probably be more buyers than sellers not too far below the July low.
What happens if August grows into a huge bear trend bar closing on its low? That would make a trend reversal more likely than simply a pullback in a bull trend.
What if August is a small bear bar and September trades below the August low? Unless either August or September is a big bear bar, the odds will still favor a new high within a few months.
Weekly E-mini Analysis
After eight weeks in a bull micro channel, the weekly E-mini S&P500 futures finally traded below the low of the prior week (see chart). That is a pullback and it ends the micro channel.
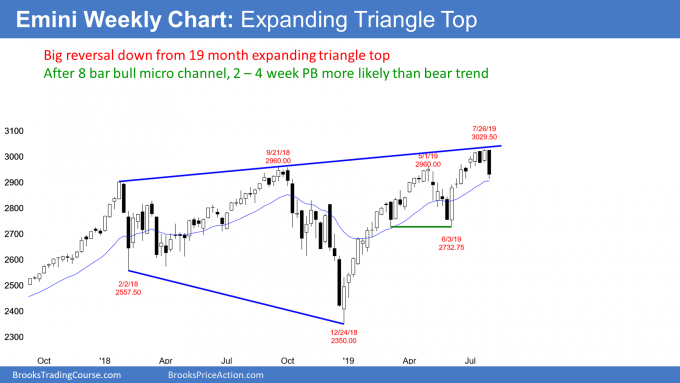
Eight weeks without a pullback is unsustainable. It is therefore a buy climax. Buy climaxes eventually attract profit-takers. This week’s big selloff was a sign that the bulls were finally taking some profits.
Eight weeks without a pullback is also a sign of strong bulls. Traders therefore expect the bulls to buy again soon.
Compare this eight-week bull micro channel with the one that began at Christmas. That one lasted 10 weeks and the pullback was only a single bar.
Will the E-mini S&P 500 do the same this time? Probably not. There was a big bear bar two weeks ago and two small dojis a few weeks earlier. The current rally is not nearly as strong as the one from Christmas. Traders should therefore expect a deeper pullback and one that lasts longer.
The eight-week rally is strong enough to make a bear trend a low probability bet. But a two- to three-week pullback at a minimum is more likely than one that ends after only one week. The pullback might last longer. However, the bull trend is strong enough so that a bull flag or trading range is still more likely than a bear trend. This is true even if this pullback tests all of the day down to the June 2732.75 low.
When will the bulls buy?
The bulls will probably take control somewhere above the June low. Both legs up this year were strong enough to make at least one more leg up likely. If there is then a reversal down from a new high, there would be a wedge top in addition to an expanding triangle top. If the rally turns down from a lower high, there would be a head and shoulders top, which is a lower high major trend reversal. In either case, the bears would have a better chance of a deeper and more prolonged selloff at that point.
It is important to remember that the E-mini has been in a trading range for 19 months. Markets have inertia and resist change. There is no credible evidence that there will be a successful breakout from the range any time soon.
Daily E-mini Analysis
The daily E-mini S&P500 chart had surprisingly big bear bars on Wednesday and Thursday (see chart). Bear Surprise Bars trap bulls in and bears out. Both are hoping for a bounce. The bulls who are trapped into a bad long want to get out with a smaller loss. The bears who missed the short want a rally that will allow them to enter with less risk.
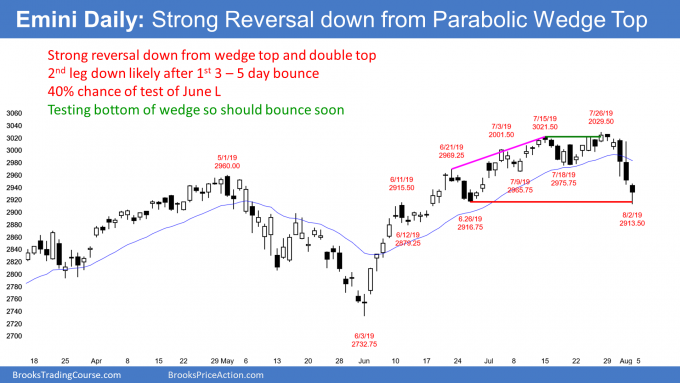
When both the bulls and bears are looking for a rally to sell, there will typically be at least a small second leg sideways to down. That is the minimum objective. Sometimes the second leg is just sideways. Sometimes there are many legs down. Since the weekly chart will probably pull back for at least two to three weeks, the daily chart should have at least two legs down.
Wedge tops
It is important to remember the consecutive wedge tops on the daily chart. I have been saying for four weeks that a wedge rally is a buy climax. A buy climax eventually attracts profit takers.
When the bulls take profits, they are not looking to buy again just a few days later. If that were the case, they would not take profits. Instead, they take profits because they are becoming increasingly concerned about a deep pullback or even a trend reversal. They do not want to buy again until they are confident that the selling will not be deep and not last a long time.
They want to see if the bears are strong enough to take control. This process usually takes at least a couple weeks. The bulls typically wait for a least a couple legs sideways to down before looking to buy again. They wait longer if the selling is still strong.
When will the pullback end?
Because the selloff on the weekly chart will probably last at least a couple more weeks, there is little incentive for the bulls to buy at the moment. Furthermore, the wedge top on the daily chart will probably have at least two legs sideways to down.
Last week’s selloff is still only the first leg down. The bears will take some profits soon and the bull scalpers will buy. That will create a two- to five-day bounce. Then, the bull scalpers will take profits and the bears will sell again. This will create a lower high and begin a second leg down.
What can go wrong with this scenario? Everything. The E-mini could crash or quickly reverse back up to a new high. Neither is likely. A selloff down to 2800–2900 range or lower over the next few weeks is what traders should expect. Then, there will probably be another new high in September or October.
Trading Room
Traders can see the end of the day bar-by-bar price action report by signing up for free at BrooksPriceAction.com. I talk about the detailed E-mini price action real-time throughout the day in the BrooksPriceAction.com trading room. We offer a two-day free trial.


