
Many market analysts believe the 30-year U.S. Treasury bond topped out in July 2016. It appears close to testing that high, notes Al Brooks.
The 30-year U.S. Treasury Bond Futures is continuing up from the October low. The rally is a test of the July 2016 nested wedge top. There will probably be a reversal down starting within six months and lasting at least 10 years.
The 30-year Treasury Bond futures monthly chart has rallied strongly since the October low (see chart). The September 2017 high was the right shoulder of a head and shoulders top. Once the May candle broke above that high, the top failed. May might now be a measuring gap. A measured move up from the Oct. 9 low to the March high is 165-14.
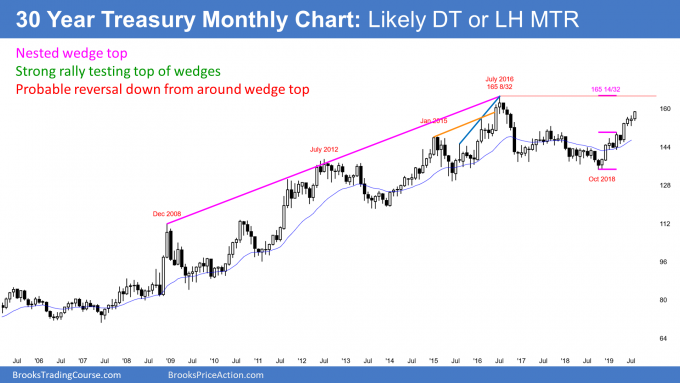
Why is that important? Because the July 11, 2016 all-time high is 165-08. A measured move would be at a new all-time high.
Why does that matter? The monthly chart had nested wedge tops on July 11, 2016. There were several levels of nesting over the prior nine years, and that increases the probability that it is a major top. Major trends in the bond market last 10 to 30 years. If this rally reaches its target, then the top will have failed.
What happens if the 2016 top fails?
It is important to realize that trend reversals often fail, but then succeed after a second attempt. The theoretical stop for the bears is one tick above that July 2016 high.
When a rally breaks above an obvious stop level, my general rule is that there is a 50% chance of a swing up. There is also a 50% chance of a failed breakout and a second reversal down. I adjust the odds based on context.
Since the nested wedge top is so reliable, a breakout above it may only have a 40% chance of a strong move up from there. Consequently, if the bulls get their new high, traders will again look for another attempt at a major reversal down. That would be a higher high major trend reversal.
A major reversal down can also come from below the prior high. It would then be a lower high major trend reversal. While the 10-month rally is strong, traders will be looking for a major top within the next six months.
Trading Room
Traders can see the end of the day bar-by-bar price action report by signing up for free at BrooksPriceAction.com. I talk about the detailed E-mini price action real-time throughout the day in the BrooksPriceAction.com trading room. We offer a two-day free trial.


