
Social media stocks have grown exponentially, and there are numerous potentially profitable chart formations forming, reports Suri Duddella.
Social Media has changed the way people live, interact, and work. As the popularity of various social media platforms continues to grow and have become publicly traded, investors have become interested as their market caps grow. Social Media stocks continue to post robust revenue growth in 2019 as they build their advertising models and create new revenue streams. Facebook (FB) delivered great quarters with massive growth in advertising and Twitter (TWTR) management has been consistent with the turn-around. The other social media stocks like Pinterest (PINS) and Snap (SNAP) has shown profitability with additional growth and sales.
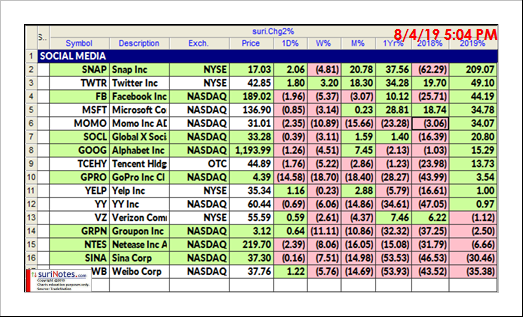
The following chart shows the Social Media stocks and their price performances in 2018 and 2019.
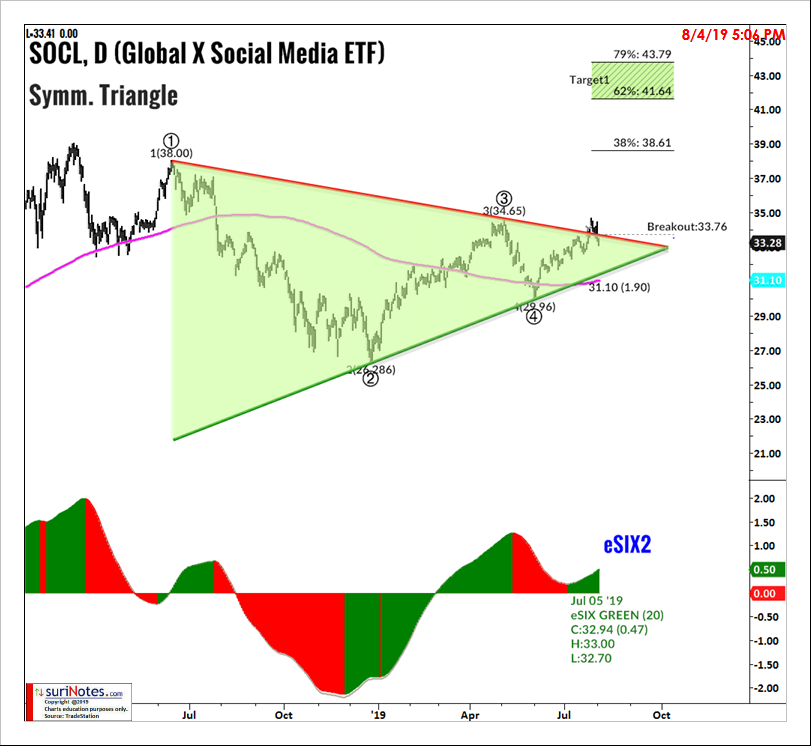
Social Media Index ETF (SOCL) has become a popular method for investors in the social media sector. Holdings of the fund span all sizes of companies. Most traders and investors look for SOCL for forecasting the future performance of the social media sector. This way a trader can invest in the sector and not face undue risk from one company collapsing.
Looking at a SOCL chart, the recent price action in June 2019 helped it to rally through its 200-day moving average as it formed a Symmetric triangle formation. SOCL has been trading in lower-low pivots and higher-high pivots since June 2018 to form a Symmetric Triangle pattern. Symmetric Triangles (coils) can be characterized as areas of indecision.
Market price-action pauses during these indecision periods as prices trade in a consolidation phase. Volume tends to be diminished during these consolidation phases. Eventually, a resolve (breakout or breakdown) from the upper or lower trend lines will result, and prices will explode out the triangles. The great thing about symmetrical triangle formations is that, whether you are betting on a upside or downside breakout (or both) the tighter the coil tightens, the closer you can place your stop loss, creating a low risk entry.
The SOCL breakout level is above $33.76. You can enter on a buy stop at $33.77, your first profit target is $38.61, you may want to take a partial profit there and move your stop loss there as SOCL approaches your second profit target at $41.64.
The companies which are the most recognizable media platforms in the U.S. are Facebook, Twitter, Snap and Pinterest. Currently Snap has outperformed Twitter and Facebook in 2019.
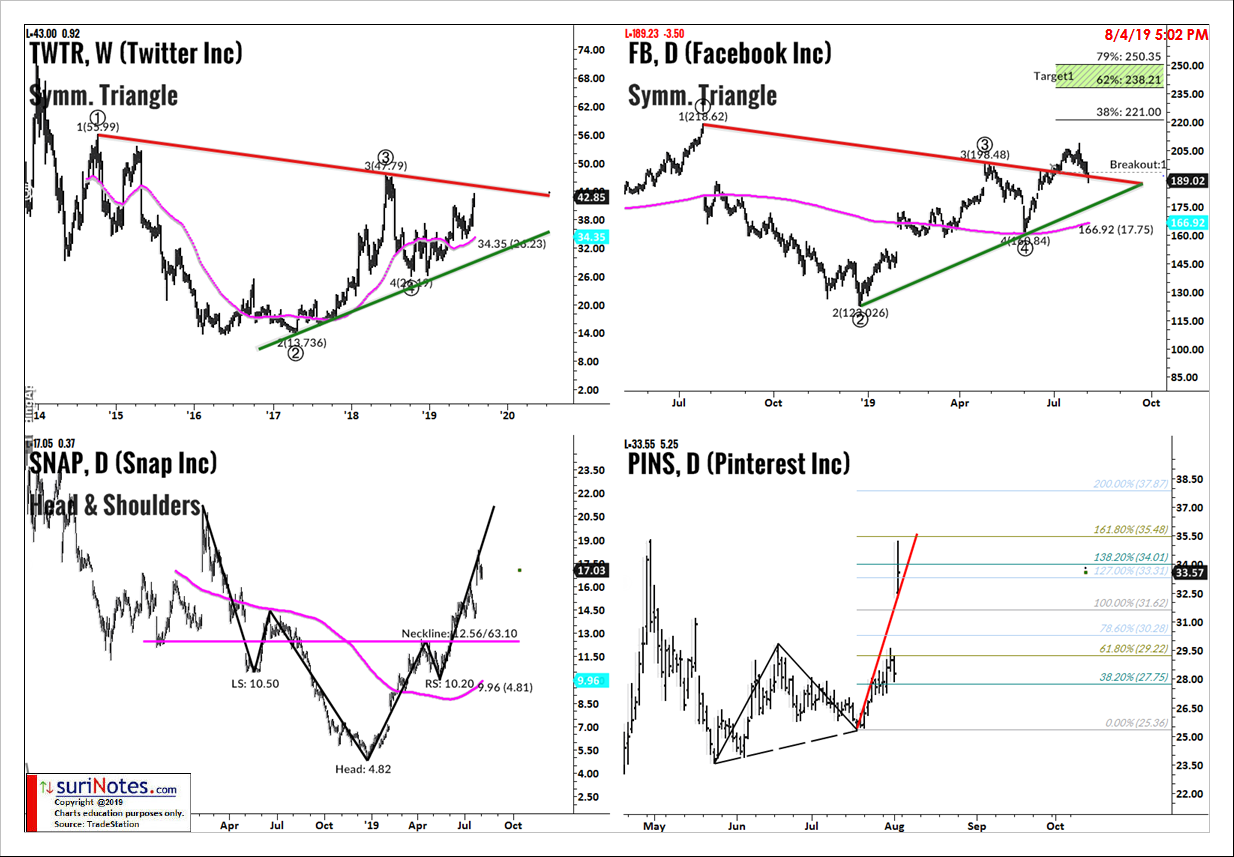
Twitter: Twitter (weekly) is forming a broader Symmetric Triangle pattern. It also has a Cup & Handle breakout pattern, which is also a bullish pattern. On the weekly chart, if Twitter breaks above $44, Twitter upside targets maybe $62, $70-75.
Facebook: Facebook's daily chart shows a Symmetric Triangle pattern breakout above $193.5. Upside targets are set at $221, $238-250.
Snap: The Snap daily chart formed an Inverse Head & Shoulders pattern with a neckline at $12.56. Upside targets: $17.80 to $21.
Pinterest: PINS’ daily chart formed an ABC Bullish pattern with an entry above $26.50 and a stop below $25. Profit targets are at $31.62 and $34.
Find more of Suri’s work at surinotes.com.


