
Last week’s rebound in crude suggests a near-term bottom in a continuous trading ranges, notes Al Brooks.
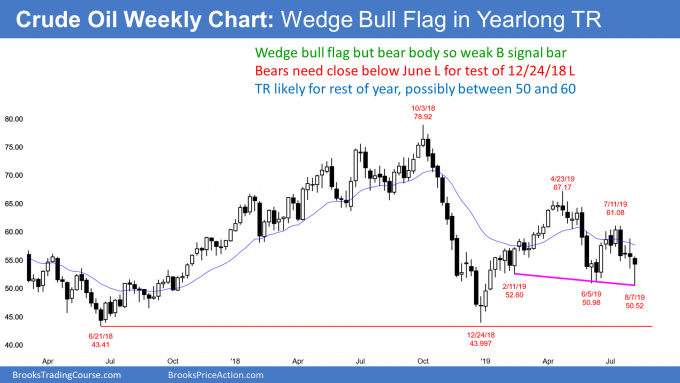
Crude oil futures have formed a wedge bull flag on its weekly chart. But the bear body and many recent dojis make a continuation of the yearlong trading range likely.
Crude oil futures reversed up last week from a breakout below the June low. It now has two legs down from the April high (see chart).
I have written several times that the December to April rally was a Spike and Channel bull trend. There typically is a break below the bull channel and then a test down to the start of the channel. That is the Jan. 14 low on the daily chart (not highlighted on the weekly chart). At that point, the chart usually transitions into a trading range with that first pullback in January being the start of the range. Everything that has happened since the December low is consistent with this common pattern.
The bears want the leg down from the July 11 lower high to lead to a break below the December low. More likely, the chart will reverse up from somewhere above the bottom of the seven-month trading range. This week might be the start of a leg up.
Crude oil forming wedge bull flag
The bulls see the Feb. 11 low on the weekly chart as the first leg down in a wedge bull flag. The June low is the second leg down. They are hoping for a reversal up this month. There would then be three legs down in a trading range. That is a triangle. Since it is sloped down slightly, it is more precise to call it a wedge. You can call it a wedge bull flag since it might be a pullback in the bull trend that began at Christmas.
Since it is forming above the December low, there will probably be a reversal up within a couple weeks. It might have started last week. Traders see the July lower high as the first target.
Remember, all year I have been saying that crude oil would probably be in a trading range for all of 2019. Traders should expect reversals. They look to buy low, sell high, and take quick profits.
Crude oil is now low in the range. Since the July selloff was strong, the daily chart might have to go sideways for a couple weeks before traders believe that the selling has ended. Once they do, they will look to buy a reversal up.
Trading Room
Traders can see the end of the day bar-by-bar price action report by signing up for free at BrooksPriceAction.com. I talk about the detailed E-mini price action real-time throughout the day in the BrooksPriceAction.com trading room. We offer a two-day free trial.


