
No commodity reflects the global economic outlook as much as copper. And copper is currently displaying two key chart patterns that indicate a major move, most likely down but with a chance of an upside breakout, reports Suri Duddella.
In August, the U.S.-China trade conditions took a downturn as trade tensions rise due to the newly proposed 10% tariff on an additional $300 billion in Chinese goods. The proposed tariff affects nearly all the U.S. imports from China, including industrial metal Copper. Copper is one of the strongest measures of the global economy and global manufacturing. Since President Trump's election in 2016, copper futures prices have fallen from $3.43 per. Lb. to current prices of $2.18.
In a recent proposal for additional tariff's for European products, copper prices may see even further downward prices. Institutional investors and traders may be concerned as copper prices could affect various manufacturing and consumer products like computers, building materials, electronics, consumer products and automobile/airline industries. This, in turn, could pressure the stock and commodity markets.
Most analysts think if the U.S.-China trade war worsens, commodity prices may fall and effect the price of copper. In the last 10 years, copper prices have traded from $1.89 to $5.10. If there is no dramatic turn-around in the U.S.-China trade war, commodity prices may continue to fall and copper may see lower prices.
Copper weekly charts are currently trading in two noticeable chart patterns: Head & Shoulders and a Symmetric Triangle.
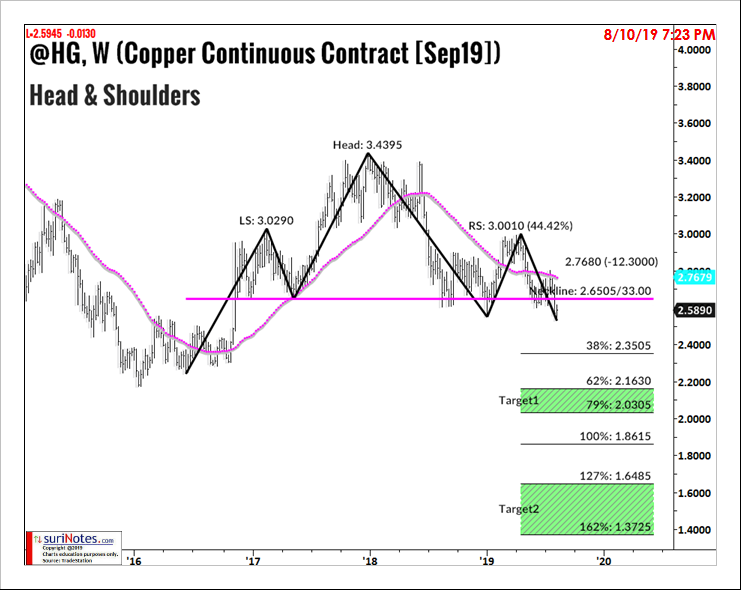
Copper weekly chart's Head & Shoulders Pattern
Since President Trump's election in 2016, Copper has traded as high of $3.43 to a current low of $2.59 while forming a Head & Shoulders pattern.
The Head and Shoulders (H&S) pattern is one of the most popular chart patterns in market analysis. Typically, the H&S patterns form near market tops in an established sideways to up trending or bullish markets. The H&S patterns are reversal patterns as they reverse its prior uptrend and follow a bearish or downtrend from its breakdown.
These patterns are signified by three successive peaks resembling two shoulders on both sides and a head in the middle. The head is the largest of the three peaks. After pattern completion, if price closes below the neckline with increased volume, enter a short trade below the breakout bar's low. Targets are projected from the neckline level. Measure the height of the head and use Fibonacci ratios to compute targets. The first target range is 62% 79% of the height of the head and the second target range is 127% to 162% below the neckline.
The current copper weekly chart is showing a Head & Shoulder's pattern with a neckline at 2.6505. Prices closing below the neckline for consecutive bars is considered to be a breakdown. Targets are set at 2.3505 and 2.03 to 2.16.
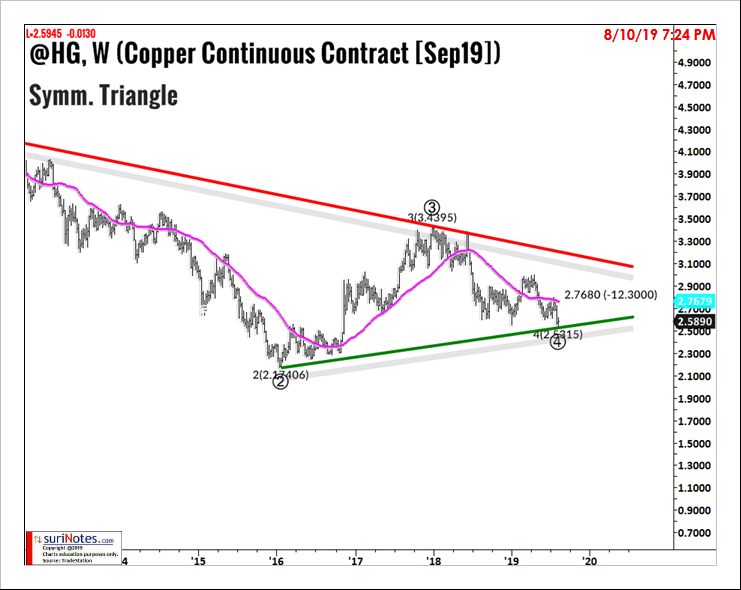
Copper's (Weekly) Symmetric Triangle pattern
Copper's weekly chart also shows a long-term Symmetric Triangle pattern from a high of $4.207 (2012) to the current low of $2.5945 (2019). Symmetric Triangles (coils) can be characterized as areas of indecision. Market price-action pauses during these indecision periods as prices trade in a consolidation phase. Volume tends to be diminished during this consolidation phases. Eventually, a resolution (breakout or breakdown) from the upper or lower trend lines will result, and prices will explode out the triangles. If price closes below the current low pivot, it may send Copper prices much lower.
Find more of Suri’s work at surinotes.com.


