
There are a number of technical factors indicating a short in airline JBLU, writes Elizabeth Harrow
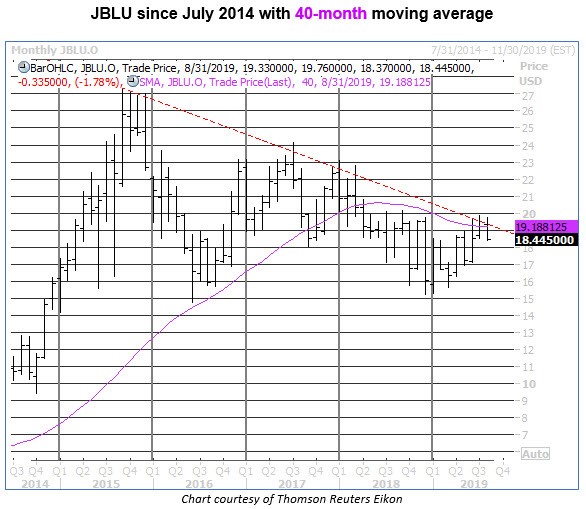
Discount carrier JetBlue Airways (JBLU) looks set to encounter some turbulence on the charts, according to data from Schaeffer's Senior Quantitative Analyst Rocky White. The stock is fresh off an encounter with long-term resistance at its 40-month moving average — a trendline equivalent to just over three years' worth of price action — and historical returns indicate that previous run-ups to this key technical level have been resoundingly bearish for the airline stock.
Looking back, there have been seven prior instances of JBLU closing within one standard deviation of its 40-month moving average after a long stretch spent beneath this trendline (defined as 80% of the time over the past 20 months). Following those prior tests of its 40-month, JBLU was trading lower four weeks later 100% of the time, with every single return negative over this time frame (see chart).
What's more, the stock's average four-week return after a 40-month moving average resistance test is a 9.2% drop. Longer term, JBLU averages a three-month decline of 13.2% after rising to test this moving average, though the percentage of positive returns improves to 17% by the three-month mark.
Adding to the technical trouble this time around, JBLU appears to have just created the latest in a series of lower highs dating all the way back to September 2015. Over the past couple of months, the equity has repeatedly stalled out near the site of a descending trendline connecting these lesser peaks.
Meanwhile, short sellers have already been piling on the struggling airline issue. Short interest ramped up by more than 59% in the most recent reporting period, and now accounts for 5% of the stock's float. That's a pretty steep increase, but short interest could still balloon another 46% from here before revisiting its June 2018 high.
What's more, the number of JBLU shorted shares would need to double to match their October 2015 levels (and that was back when the equity was actually trading near decade-plus highs). If bearish speculators continue to bet against the stock in response to the flagging price action, the resulting selling pressure could accelerate JBLU's downside momentum.
There's room for downgrades, too. Despite the long-term decline in JetBlue shares, there are still five "strong buy" ratings and eight "holds," compared to only one "sell." Any negative notes from the bullish holdouts here could spark additional losses for the stock.
And with the latest earnings report just a few weeks in the rearview, short-term options are cheap for those looking to play this JBLU sell signal via put options. The stock's Schaeffer's Volatility Index (SVI) checks in at 28%, which ranks in the 33rd percentile of its annual range meaning speculative at-the-money JBLU options have priced in lower implied volatility expectations only one-third of the time during the past year.


