
Bitcoin is a market and like all markets responds to market technicals, and Bitcoins technical look very weak, reports Al Brooks.
Bitcoin is trying to hold above $10,000, but there is a 50% chance that it will fully retrace the June/July buy climax and test at $7,500.
Bitcoin has rallied strongly from the December low. But it has been in a tight trading range for eight weeks at a 50% retracement of the 2018 crash (see chart). The bars on the weekly chart (not show) have been big and most have prominent tails. Also, there have been many reversals. There is no sign of an impending breakout up or down.
Because of the eight-month rally, TV only interviews the bulls. The least bullish expect a test of the $20,000 all-time high. The most bullish talk about a rally to $200,000 within two years.
Since Bitcoin is a market, it behaves like all other markets. Trading is ruled by logic and self-interest. There are enough buyers and sellers to create reliable patterns. Since Bitcoin is unregulated and there are still some big thieves out there, the swings can be big. But its chart looks no different from that of any other market.
Because of the tight trading range and big reversals, it is now in a limit order market. It is in Breakout Mode. Traders are buying one to two-week selloffs and selling out on one to two-week rallies. The bulls are trying to hold it above $10,000. They see the two-week selloff as a pullback from a breakout above a six-week triangle on the daily chart.
However, there are many emotional bulls who are too eager to buy. Look at all the failed rally attempts in 2018. Those were all bull traps. CNBC kept putting on confident, professorial, purportedly rich Bitcoin bulls who kept claiming that the bear trend ended. The audience believed that they guys made a fortune by truly understanding Bitcoin. If they say that Bitcoin was about to resume up, you have to trust them.
Bad idea. Profitable traders only trust themselves, not TV pundits. The weak bulls kept buying and repeatedly got trapped by the absence of strong bulls willing to buy higher.
The same is true now. Traders should expect a lack of follow-through buying. In addition, it is better if traders trade small, use wide stops, and have the ability to scale in lower. That will give them the best chance of trading Bitcoin profitably.
Will 10,000 hold?
Will the psychologically important $10,000 Big Round Number hold? I suspect not. Last week’s reversal up from below $10,000 is more likely just the start of another leg in the eight-week trading range than a resumption of the bull trend.
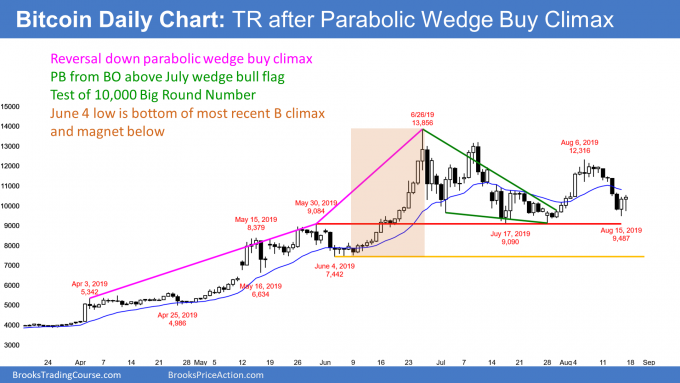
The parabolic rally in 2019 had three legs up. The first ended with the April 3 high and the second ended with the May 30 high.
You can see that the third leg up from the June 4 low was huge. A huge rally typically results in exhausted bulls. They take profits and then are not be too eager to buy again. There often has to be a bear breakout below the bottom of the final leg up before the bulls will believe that the pullback has ended. Consequently, anyone buying now has a better chance of making money trading small and using a wide stop. That June 4 low of $7,442 is an important magnet below.
How low can Bitcoin go?
While the bulls are hoping that the pullback ended with last week’s test of $10,000, there is better than a 50% chance of a retracement of the entire third leg up. That means a test of the June 4 of $7,442. If $10,000 does not hold, that is the next target. At the moment, traders should expect it to get tested within a few months.
When there is a reversal down from a parabolic wedge, the bulls typically want to see a test of the bottom of the first or second pullback. The second pullback was the May 16 low of $6,334. That was also a test of a gap above the May 10 high. That is the next support.
Finally, a much less likely target is the bottom of the first pullback in the wedge bull channel. That is the April 25 low of $4,986.
Since Bitcoin has been sideways for eight weeks, it might have another leg up before breaking below $10,000 and testing $7,442. But unless the bulls break far above the June high, Bitcoin will probably have to go lower to find buyers.
Trading Room
Traders can see the end of the day bar-by-bar price action report by signing up for free at BrooksPriceAction.com. I talk about the detailed E-mini price action real-time throughout the day in the BrooksPriceAction.com trading room. We offer a two-day free trial.


