
Apple broke out of a symmetrical triangle range suggesting a gain up to $240, but it most hold support, reports Suri Duddella.
The U.S. announcement of a delay in 10% tariff on $300 billion of Chinese products like phones and computers until December 2019 could be good news for Apple (AAPL) stock and its suppliers. The delay could give some breathing room for AAPL as it readies newer products for the holiday season. AAPL is scheduled to announce iPhone 11, newer AirPods and new iWatch 5 series for the holiday season.
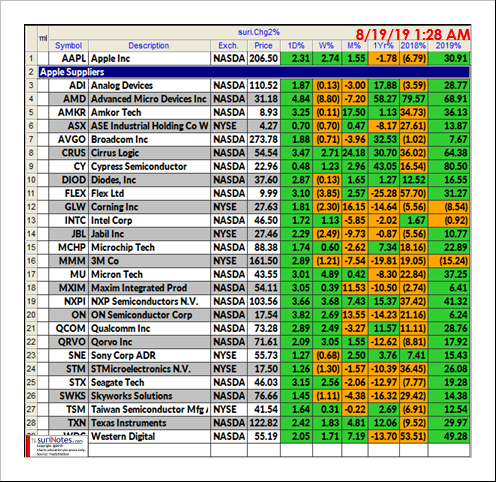
Over the last two decades, Apple has sold more than 1 billion iPhones, iPads, laptops and smartwatches. Many of AAPL component suppliers have seen massive revenues, and many analysts use component companies as a strategy to invest in Apple products. Here are a few leading AAPL supplier companies and how they performed in 2018 and 2019 (see table below).
AAPL Symmetric Triangle Pattern
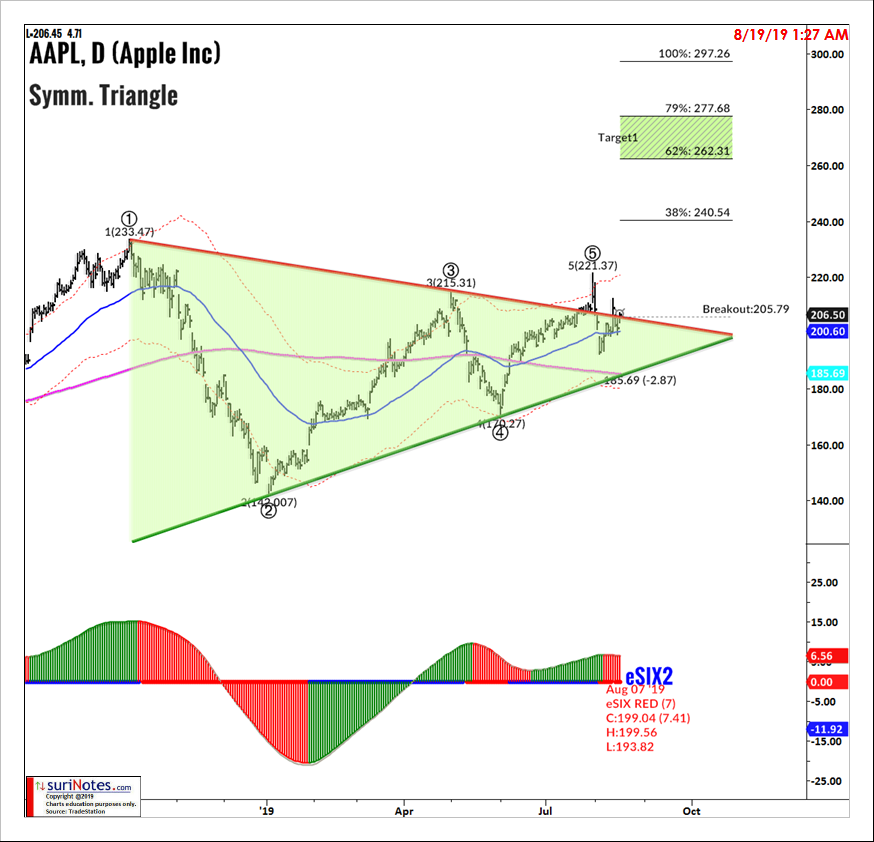
Looking at the AAPL daily chart shows a breakout of the Symmetric Triangle formation. Symmetric Triangles can be characterized as areas of indecision. Market price-action pauses during these indecision periods as the underlying trades in a consolidation phase. Volume tends to be diminished during consolidation phases. Eventually, a resolve (breakout or breakdown) from the upper or lower trend lines will result, and prices will explode out the triangles. Usually, triangles break in the direction of its prior trend, hence signifying its Continuation Pattern status. However, in many cases triangles produce a reversal pattern after its initial breakout in the opposite direction, giving the trader the opportunity to trade the opposite of the pattern.
Since October 2018, AAPL daily chart has formed a Symmetric Triangle pattern as it made a series of lower highs and higher low pivots. AAPL's Symmetric Triangle breakout level is at $205.79. A long trade is entered above the breakout price with a stop below the recent pivot low of $192. The first target is set at $240.50, and the next target range is at $262 up to $277. If AAPL reverses its breakout trend and trades below the last lower trendline, the Symmetric Triangle pattern is considered to be a failed pattern.
Find more of Suri’s work at surinotes.com.


