
This trading strategy can lock in gains and protect your downside in bonds reverse, reports Jay Soloff.
The stock market has been plenty volatile over the last couple weeks, but the real story has been what’s going on in the bond market. Many of the financial headlines you see are about the inverted yield curve or the parabolic move in long-term U.S. bonds.
Let’s start with the inverted yield curve. What does that even mean? First off, the yield curve refers to the yield of fixed income products for all of the available time horizons. This is also known as the Treasury term structure or Treasury curve. It basically runs from one-month T-bills to 30 year Treasury bonds.
Normally, when the U.S. economy is in growth mode, the lowest yields are in the shortest-dated bonds and the highest yields are from the 30-year bonds. This makes sense due to the cost of carry for having money locked up in bonds for longer periods.
However, when there is fear of a recession, the curve can get inverted. That is, short-dated Treasuries can have a higher yield than longer-dated bonds. If investors expect a slowing economy, they can be in a rush to buy bonds before yields get lower. Also, short-term government bonds are a safe place to park money during times of uncertainty.
(While the new surrounded the inversion of the two-year Treasury note and 10-year Treasury bond—which many economists view as the benchmark for the yield curve — the yield curve first inverted several months ago when yields on 10-year notes dropped below yields on three-month bills, and refers to any time a shorter-term Treasury product has a higher yield than a longer term Treasury.)
This high demand for short bonds can (and does) invert the yield curve. In most cases, the curve will invert prior to a recession officially happening. As such, many investors count an inverted yield curve as a surefire forward indicator that a recession is on the way.
Even now, the economic numbers don’t look terrible, but the Treasury curve has become inverted. That’s why all the headlines are talking about a looming recession. What’s more, bond buying activity has been extreme.
You can see from the chart of iShares 20+ Treasury Bond ETF (TLT) just how much buying has been going on in bonds. TLT is the most actively traded exchange traded fund based on government bonds. The move in TLT in August is nothing short of parabolic.
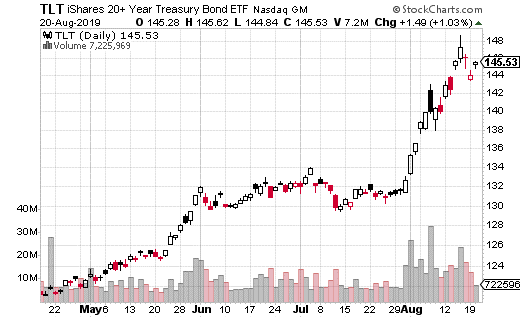
As you probably guessed, moves like the one in TLT are not the norm for bonds, which are generally far less volatile than stocks. The question is, what’s next for bonds after such an unusual move? Let’s look to the options market for clues.
A recent, large covered call trade in TLT may provide some insight as to what institutions expect for the next month. A buyer purchased 450,000 shares of TLT at $144.97 while simultaneously selling 4,500 of the Sept. 20 145 calls for $2.65.
The transaction resulted in the buyer collecting $1.2 million in premiums. This premium means the TLT shares are protected down to $142.32 before any losses occur. However, the calls were sold at-the-money, so max gain is at $145 or roughly the price of TLT at the time of the trade.
This is essentially a yield and protective trade. The trader doesn’t expect TLT to significantly exceed current levels, but also doesn’t expect a big drop. If the price remains at the present level over the next month, the position will earn a yield of 1.8%. That’s just for a month though, annualized it’s 21.6%.
This is the sort of trade I strongly recommend if you own bonds or TLT and want to generate additional yield on your holdings. Plus, it offers a small amount of protection to the downside should bonds end up selling off in the next month.
Jay Soloff is the Options Portfolio Manager at Investors Alley. He is the editor for Options Profit Engine, an investment advisory bringing you professional options trading strategies, with all the bells and whistles of Wall Street, but simplified so all you have to do is enter the trades with your broker.


