
A lot at currency, fixed income and precious metals commercial activity from Andy Waldock.
Remember that tracking the Commercial participants’ actions allows us to anticipate the end of a market’s move. Historical records help define a market’s capacity through the actions of its commercial participants. Speculative records, on the other hand, can grow to absurd levels. Therefore, while we can anticipate, we always let the market’s movement provide the impetus for our actions. In other words, we don’t enter until the market reverses, and we believe the speculators are about to be wiped out as they’ve run out of new blood to fuel the move.
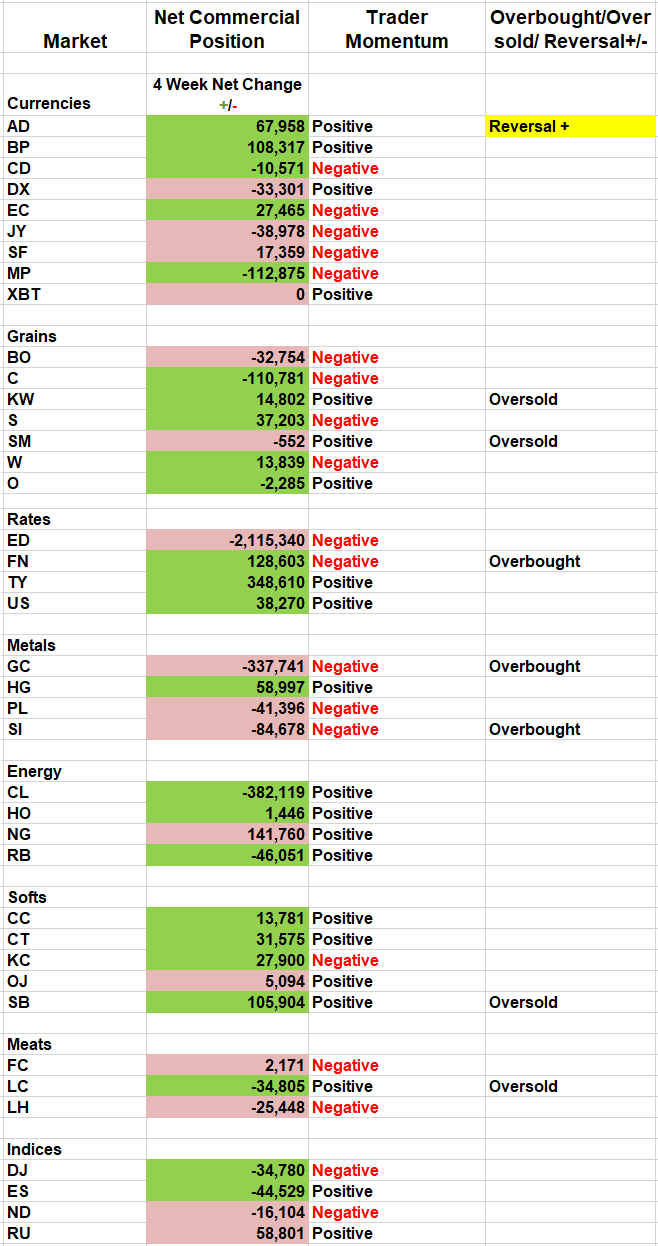
Here is our most recent analysis on the Commercial activity in the Commitments of Traders (COT) report, sector by sector.
Currencies
Japanese Yen: The Japanese Yen’s decline triggered a momentum-based short sale under .9425. Commercial traders were once again heavy sellers in the yen. Our short sale is protected with a buy stop at .9647. First support is around .9230. The bigger question is, “Will this trigger the next run to new lows, closer to .9000?”
Swiss Franc: The Swiss franc is attracting significant commercial selling. It’s beginning to look like the mid-August high of 1.0466 will be the most recent high as the market moves to new lows. A violation of 1.0140 will confirm the downward bias, in which case, the May lows below 1.0000 will be in jeopardy.
Euro FX: The euro is managing to hold some strength relative to the British pound’s Brexit and Swiss negative rates. A safer way to play the Swiss franc move may be the spread buying the euro and selling the Swiss Franc. Please, call for details.
Interest Rates
Eurodollars: Commercial traders have been sellers four out of the last five weeks, setting a record net short position last week at (2,115,340) contracts. Observationally, the current commercial selling fits their pattern of selling high volatility and buying low volatility in the Eurodollar futures. Framing the market in this context makes the current prices look much more like a top than the rally ending in June of 2016. Continue to look for short-selling opportunities.
30-year U.S. Treasury bonds: While commercial traders have been hard sellers of the short end of the yield curve, it’s their purchases in the 30-year U.S. Treasury bonds that should tip their hand to a flattening yield curve. The shift in commercial trader bias on the long end of the curve has been undeniable as they’ve been net buyers every week but two since mid-June. The commercial position push towards a flattening yield curve is telling us that deflation may be a bigger problem than inflation.
Metals
The yield curve and inflation/deflation debate brings us to the metal markets. I’ve left money on the table as we’ve waited for short-selling opportunities in rising markets over the last three months. However, it’s important to remember that this is a mean reversion or, reversal strategy. This is not a trend following strategy.
Commercial gold traders are within a whisker of their net short record. This group is primarily made up of miners, and the ambitious nature of their forward selling suggests that they don’t believe prices will be this high at delivery.
Miner selling plus a flattening yield curve equals deflation, not inflation. I’m not saying we won’t get inflation at some point. I just don’t believe it’s here.
These comments apply equally to the silver market. The silver miners haven’t been quite as aggressive in hedging their forward production. However, this also means that they’ve got about 30% more contracts they can sell while remaining within the historical confines of their operational needs.
Here is what Andy had to say about seasonality and the COT Report at the recent TradersEXPO New York.
Visit Andy Waldock Trading to learn more. Register and see our daily and weekly signals archive for entries and stop loss levels sent to our subscribers.


