
Crude oil’s Symmetrical Triangle Patterns offers two-sided breakout opportunities, notes Suri Duddella.
Since August, U.S. markets were whipsawed by the news of additional tariffs on Chinese imports and the continued trade war with China. That along with the fears of a slowing global economy and uncertainty regarding Federal Reserve interventions in the market has impacted oil prices and broader energy sector. If the trade war with China continues, it could impact the U.S. oil industry in other ways also. The oil industry is heavily reliant on China steel as it is considered to be much cheaper than U.S. Steel. In a trade war with China, U.S. oil pipeline industries, which are capital intensive find difficult to buy expensive steel from the U.S. manufacturers.
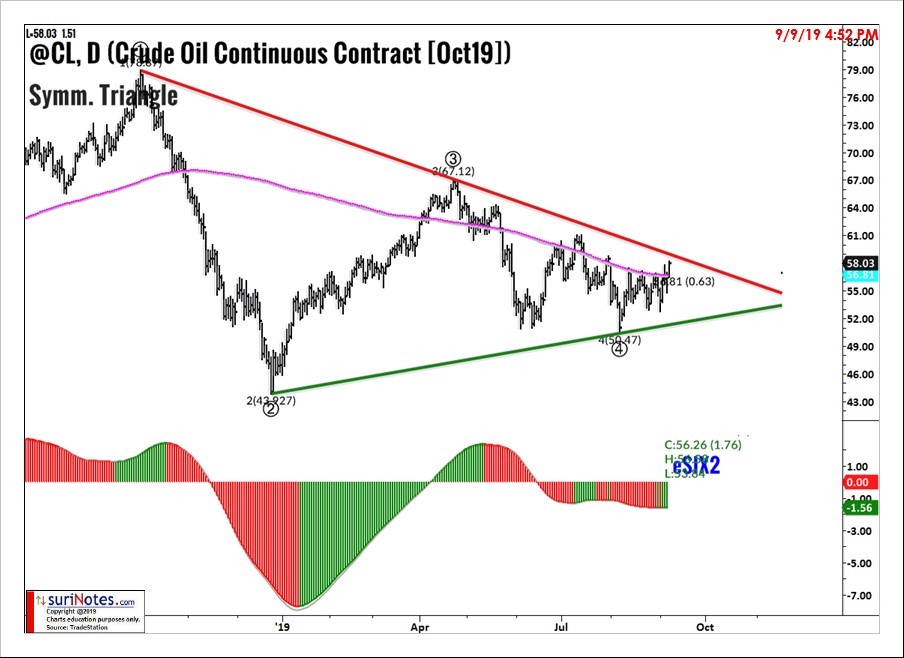
Seasonality also affects the price of crude as September is considered to be an unfriendly month for crude oil prices as summer blends no longer squeeze the supply chain. On a brighter note, recent renewed optimism on U.S.-China trade and Fed fund rates may reverse the bearish trend as crude oil is currently forming a Symmetric pattern since October 2018.
Symmetric Triangle Pattern
Symmetric Triangles can be characterized as areas of indecision. Market price-action pauses during these indecision periods as prices trade in a consolidation phase (see chart below). Volume tends to be diminished during consolidation phases. Eventually, a resolve (breakout or breakdown) from the upper or lower trend lines will result, and prices will explode out the triangles. Usually, triangles break in the direction of its prior trend, hence signifying its continuation pattern status. However, in many cases triangles produce a reversal pattern after its initial breakout in the opposite direction, giving the trader the opportunity to trade the opposite of the pattern.
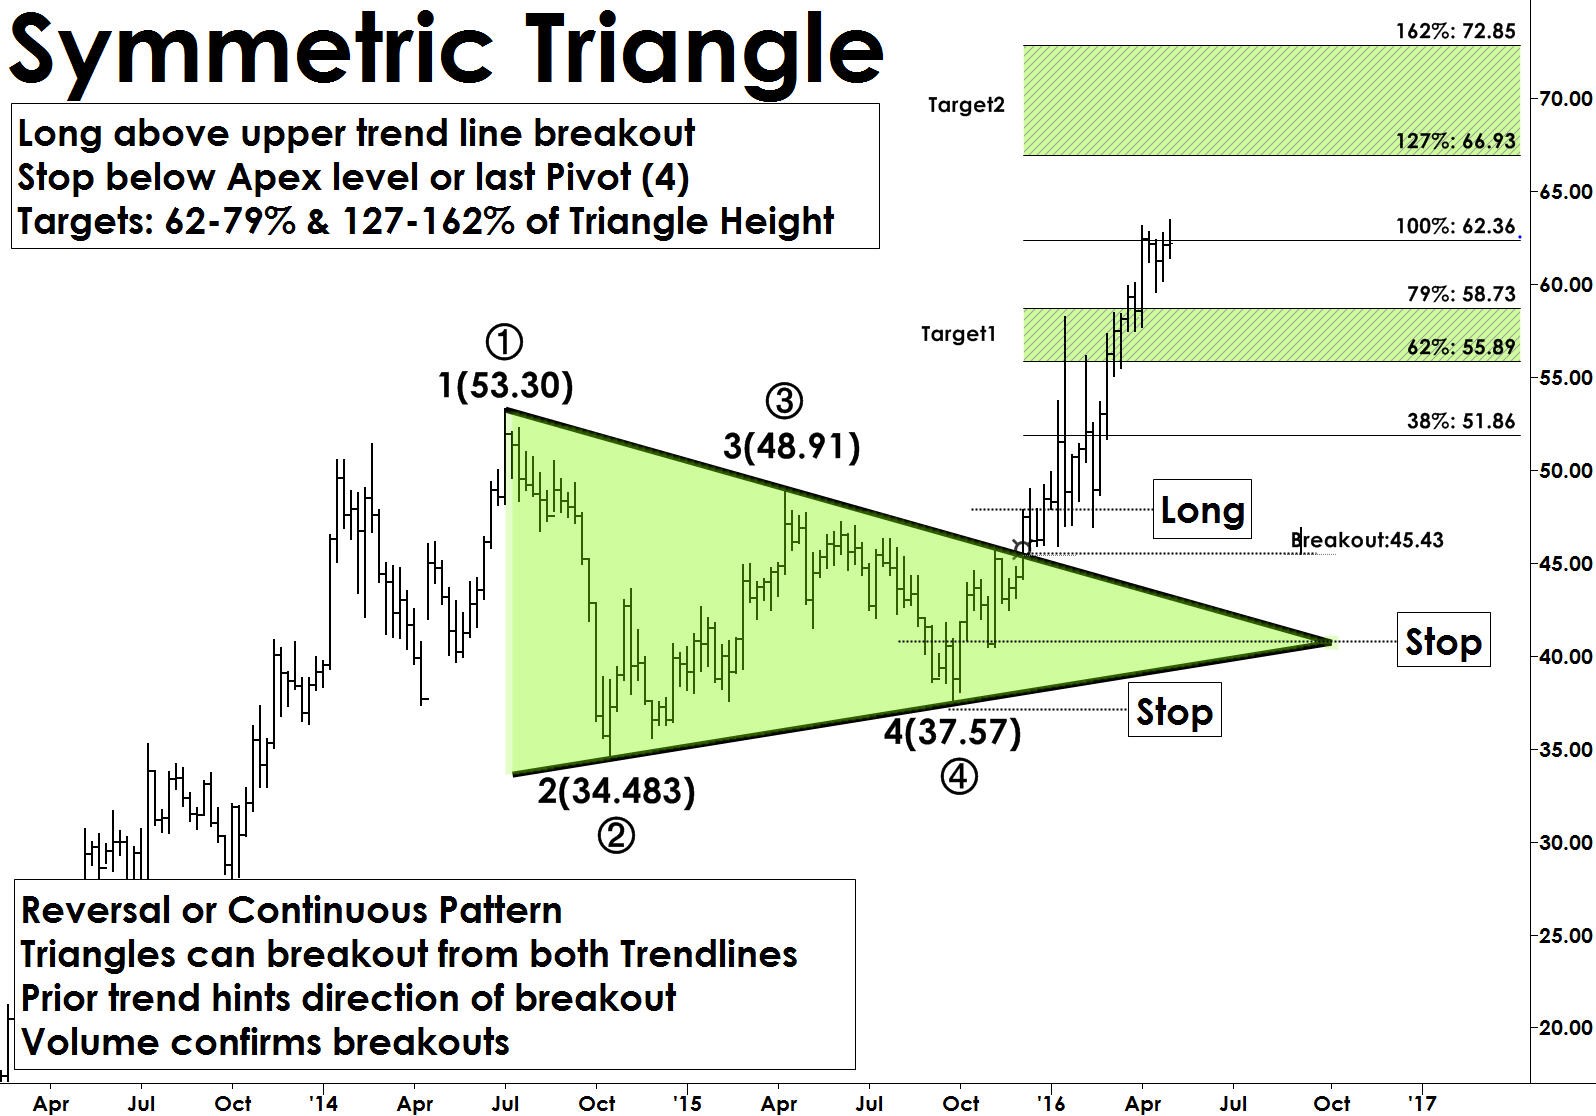
Trading Symmetric Triangle Patterns
Trade: Trades should be taken when price closes out of the upper or lower trend line in a Symmetric Triangle after forming at least two pivots on each of the trendline. The optimal breakout point should be about 50% to 75% of the width from left. When a breakout is confirmed by price closing above the breakout bar's high (in the case of upside) enter a long trade. When a breakdown is confirmed by price closing below the breakdown bar’s low, enter a short trade. Some traders employ a 2% higher price level above breakout or 2% lower price level below a breakdown to qualify as a true breakout.
Stops: Symmetric Triangle failures occur when market results in false breakouts. Place stop below the last pivot level (#4 in chart above) of the trend line for a long setup and place a stop order above the high of the trend line for a short-setup. In large Symmetric Triangle patterns, an aggressive stop level could be placed at the apex level.
Target: Symmetric Triangle targets are computed by adding the height of the entire triangle from breakout level in an upside triangle breakout. Protect targets by using trailing stops.
Crude Oil's Symmetric Triangle Pattern
Since October 2018, Crude oil has been trading in a Symmetric Triangle Pattern as prices made higher-low pivots and lower-high pivots (see chart below). Current price is trading above 200-day simple moving average (magenta line on chart) and could potentially trigger a breakout above $59. A long trade may be entered above the breakout level ($59) with a stop below $56. Targets are set at $64 to $66.
Find more of Suri’s work at surinotes.com.


