
The Russell 2000 entered a rectangle chart pattern in 2019 that could lead to a major breakout, reports Suri Duddella.
After a six-month underperformance with sideways price action, small cap stocks started to perform in September 2019. Since the beginning of 2019, the performance gap between small caps and large caps has widened, giving credit to the global economic stress, China trade-war and recession talk.
Investors common belief of small-cap companies is they are usually domestically oriented with less exposure to U.S - China's trade-war and tariffs and should perform well in case of an extended trade-war. Until the beginning of September, investors sentiment in small caps was bearish, and it seems it may be changing as small caps posted gains of 4.68% in September and 17.48% for the year 2019.
The primary benchmark for small caps is the Russell 2000 index (RUT) or the Russell 2000 exchange trade fund (IWM). These companies currently have market caps ranging from about $150 million to $5 billion. Some of the examples are Redfin (RDFN), Upwork (UPWK) and Stitch Fix (SFIX).
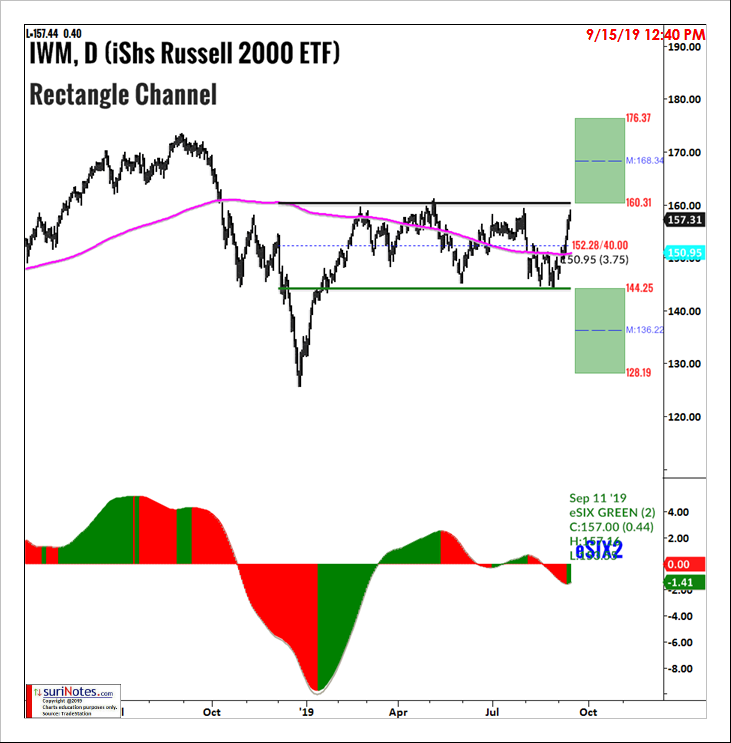
In 2019, the Russell 2000 index and IWM has been trading sideways in a Rectangle Channel and is starting to turn bullish. After a brief test at the resistance at $160-$162, IWM may see a breakout.
Trading Rectangle Channels
Rectangle Channel patterns are formed by price action between two key trendlines bound by multiple equal highs and lows. The duration of the pattern can be a few days to months. Longer duration patterns are more reliable. The pattern must have at least two pivots (equal highs or equal lows) on each of the trendlines. The price breakout can occur in any direction from the pattern, but the tendency is price will breakout in the same direction as the trend prior to the pattern formation (see charts below). The volume inside the pattern is non-decisive, but volume tends to increase during the breakouts.
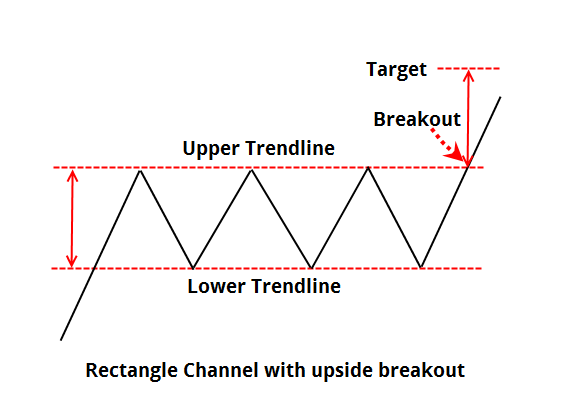
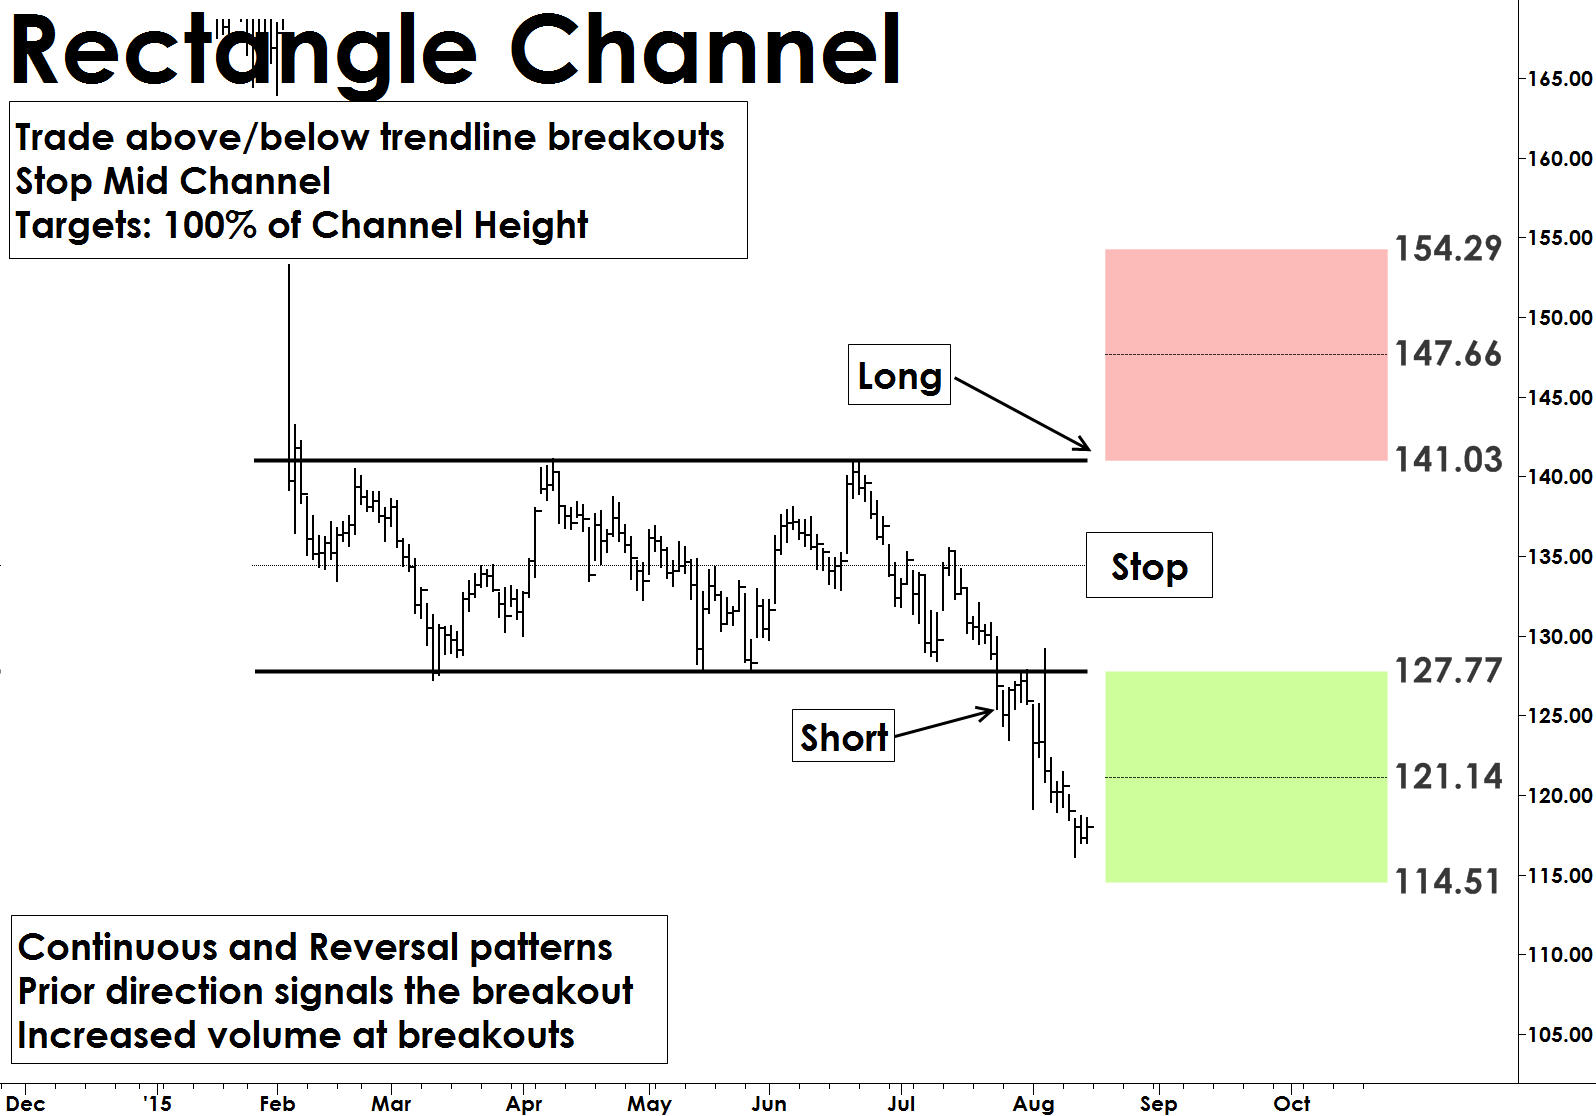
Trade: A trade setup occurs when price closes outside the trend line (upper or lower) at least two bars signaling a breakout. Trades are entered on a follow-up bar at high above the breakout bar or low below the breakdown bar.
Target: Targets in Rectangle Channel formations are based on the depth of the rectangle pattern. Targets are usually set at 70% to 100% of the depth of rectangle from the trade entry.
Stop: Rectangle patterns fail when prices retrace into the middle of the rectangle channel. Place a stop loss order just below the middle of the channel.
Trading RUT/IWM's Rectangle Channel pattern
IWM has been trading in a Rectangle channel pattern since January of 2019 as prices traded between $144.25 and $160.31.
Two potential long scenarios are presented here.
If price starts to trend higher and breaks out (upside breakout) above the upper trend line (161), go long above the breakout bar's high and place a stop at the middle of the channel ($152). Profit targets are at $168 and $176.
In case of resistance at $160-$161 and IWM pullbacks to the mid-channel ($150-$152) without a breakout, IWM may give an opportunity to enter a long trade at $152 and place a stop below 200-day simple moving average ($150). Targets are $160 and $168.
Find more of Suri’s work at surinotes.com.


