
Bearish market indicators are piling up with a poor man manufacturing report the latest, notes Mike Larson.
I’ve been debating the U.S. economic situation for a while with folks I refer to as “recession deniers.” I keep telling them the bond market has given them a road map, with one of the deepest, most-persistent flattening/inversions of the yield curve in the last three decades. It clearly points to an economic decline in 2020.
Yet they kept trying to argue with me. Until this week. That’s because on Tuesday, they got smacked over the head with an unequivocally bearish two-by-four: A manufacturing report so dismal it can’t be explained away.
Specifically, the Institute for Supply Management just said its key factory index plunged to 47.8 in September from 49.1 in August. Not only did that miss forecasts for an increase to 50.2, it was also the worst reading in any month since June 2009 (see chart).
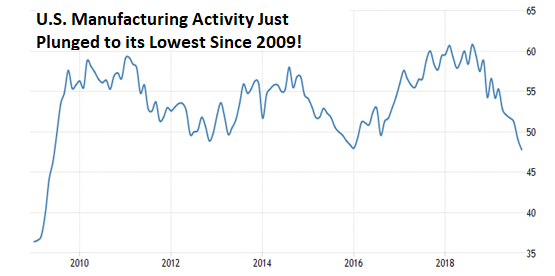
Source: TradingEconomics.com
If you look behind the headline reading to the various sub-indexes, you see the following:
- Employment activity fell to its lowest level since January 2016.
- New orders were stagnant.
- And a measure of export activity fell to its lowest since March 2009.
The weakness stems in part from the global trade war. But as I've been saying for a long time, the bigger issue is that the credit and economic cycle is turning.
We just experienced the longest, most extreme boom in easy, cheap money in U.S. history ... and now, it's petering out. It's inevitable the economy will weaken as a result.
It's also inevitable the stock market will reflect that kind of trouble.
Consider this: The S&P 500 made three attempts to hit — and hold — new all-time highs through July of this year. But unlike all the pre-January 2018 moves, they were accompanied by divergences all over the place. And not surprisingly, all of them failed.
At the same time, sectors like materials, financials, industrials and energy have lagged significantly. They're all trading well off their highs. The same goes for the Russell 2000 Index of small-cap stocks and the economically sensitive Dow Jones Transportation Average.
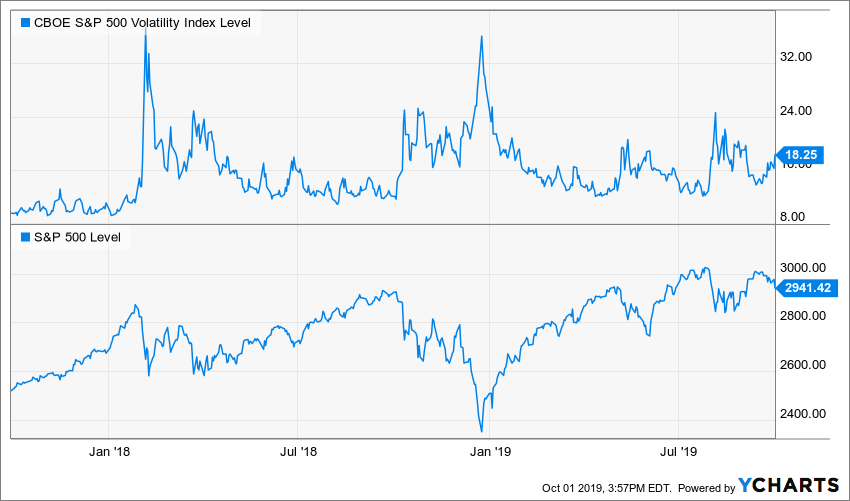
The CBOE Volatility Index (VIX) has diverged from the S&P 500 as well. It's making a series of higher lows rather than lower lows like it did before January 2018 (see chart below).
The same is true for credit spreads — the extra yield investors demand as compensation for assuming the default risk inherent in high-yield or investment-grade corporate bonds vs. underlying Treasuries.
That brings us to the present day. The S&P 500 is once again attempting to put this resistance zone around 2,900-3,000 behind it once and for all.
But as you can see in this freshly updated Weiss Ratings "BUY"/"SELL" ratio chart (below), the move is still lacking broad participation.
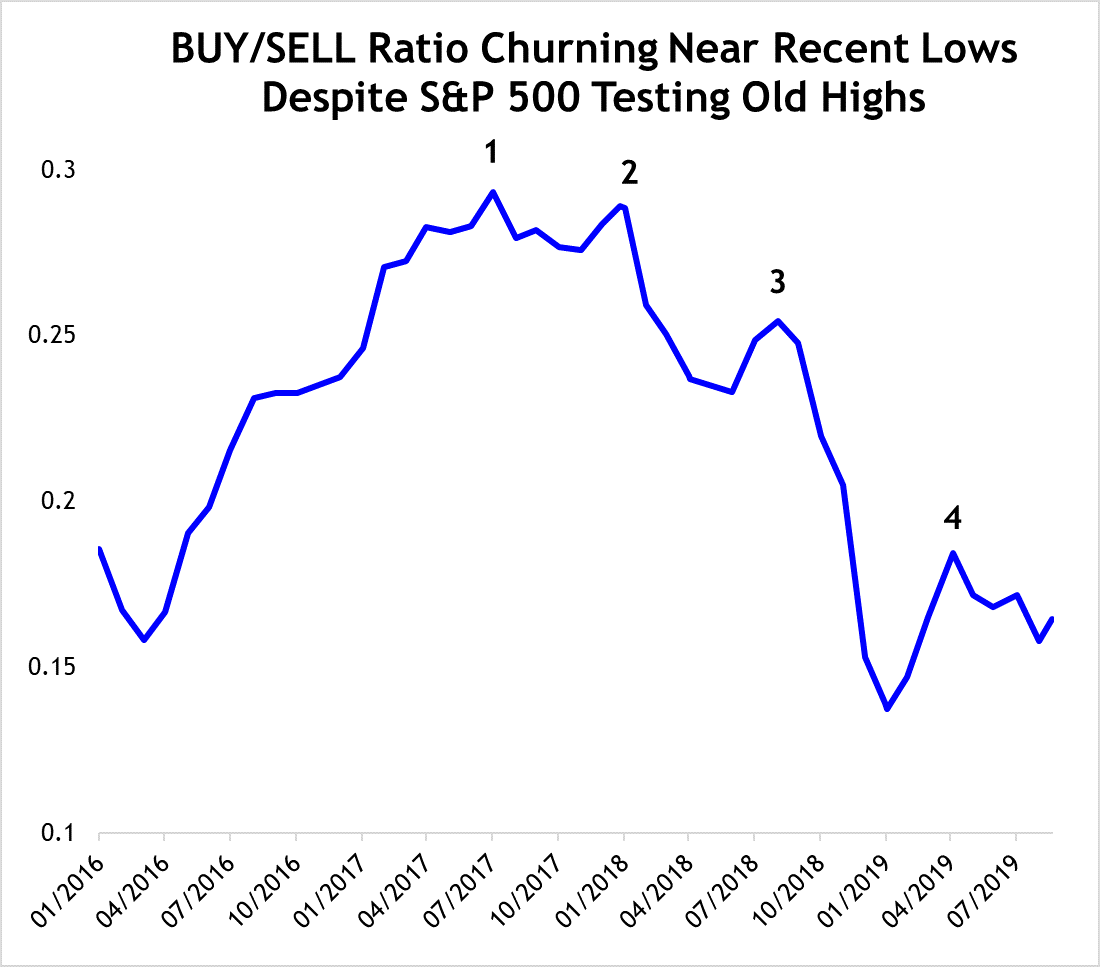
Source: Weiss Ratings, Data Date 9/18/19
So, whether or not you agree with my opinion about the market, one thing is clear:
Our unbiased, data-driven, back-tested Ratings model is still suggesting that many stocks are struggling and that the rally isn't as healthy as those we saw pre-January 2018.
The bottom line?
Your best approach here is to stay defensive, stay alert and stay focused on what the market is revealing. This isn't the same rampant, wild-running bull market we had before January 2018. You shouldn't invest as if that's the case.
Mike will be speaking at the MoneyShow Dallas, Oct. 13 to Oct. 14 at the Hyatt Regency Dallas. General information, details about my schedule, and registration information can be found here.
You can get specific names, and actionable “buy” and “sell” signals by subscribing. Subscribe to Safe Money Report here…


